Markets came through a genuinely eventful week and barely flinched. The Fed held rates on Wednesday as expected, but the room was uneasy, with three dissenters (the most since 2016) pushing for a hike. Add a large-scale yen intervention, a $45 billion hedge fund liquidating its entire public equity book after AI-trade losses, and Warsh's underwhelming first press conference, and the natural expectation was stress. Instead, the S&P 500 rose 1.0% on the week, which is either remarkable composure or a classic capitulation, a V-shaped signal. This is a market recap, not a recommendation to buy or sell.
Beneath the tape, the picture is more orderly than the headlines suggest. The Korean leverage unwind looks like a washout rather than a bubble top, with institutions absorbing the stock that distressed retail was forced to sell. The Magnificent 7 no longer trade as a single block, and the cloud names are where monetisation is signalling most clearly. Earnings and valuations still justify a constructive stance, financials and small caps look nothing like a market bracing for recession, and the caution here is one of timing, not thesis. Early August rarely rewards the gung-ho.
Market overview: leverage washes out, cloud carries the load
The week was defined by structure, not direction. A forced-liquidation event dragged momentum returns below -20% and wiped out the rally's gains before the market snapped back. The tell is who bought: in Korea, foreign institutions bought an all-time high 7.2 trillion won (around $5 billion) of Kospi stocks on Friday, exactly as retail dumped an all-time high 8.3 trillion won. That is retail being washed into safer institutional hands, a washout consolidation rather than a top.
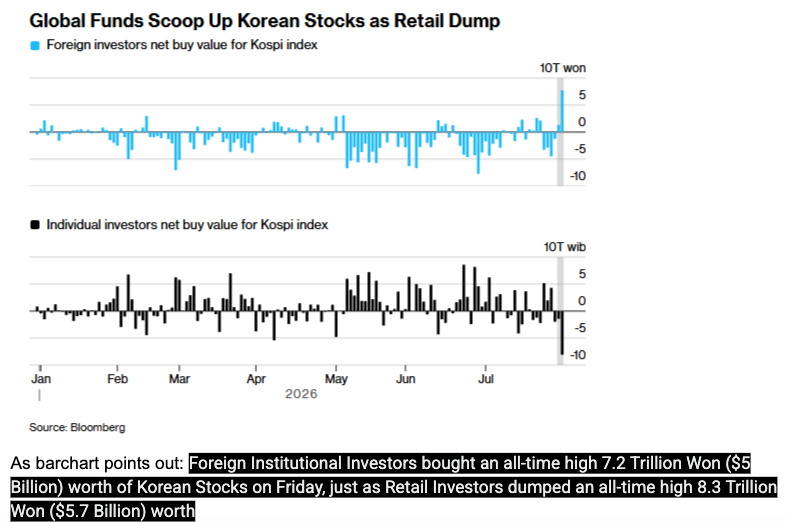
Korea: institutions bought the stock distressed retail was forced to sell.
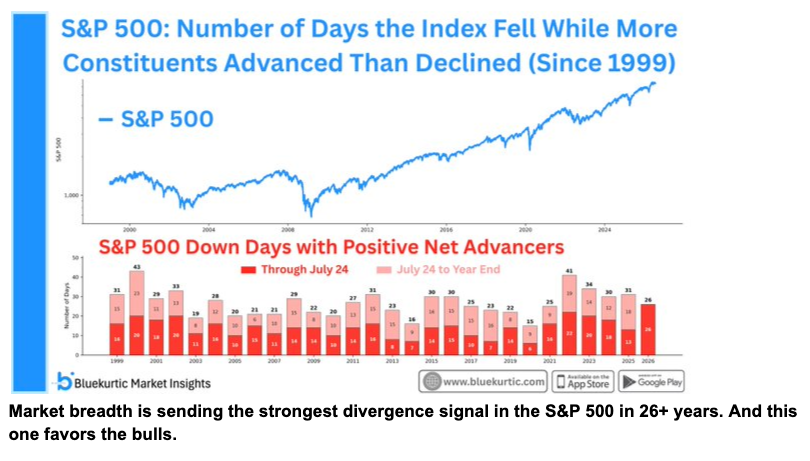
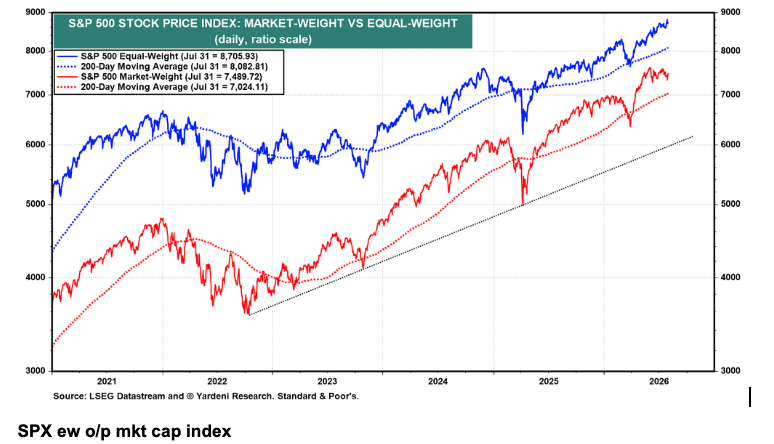
The internals stayed constructive through the noise. The equal-weight S&P continues to hold its own, and the previously under-pressure MAG4 (of the 7) had a strong bounce-back week, proof that leadership can rotate without the market breaking. Friday's large-cap bounce did mask one of the widest breadth dispersions on record, matched only by 2000 and 2020.
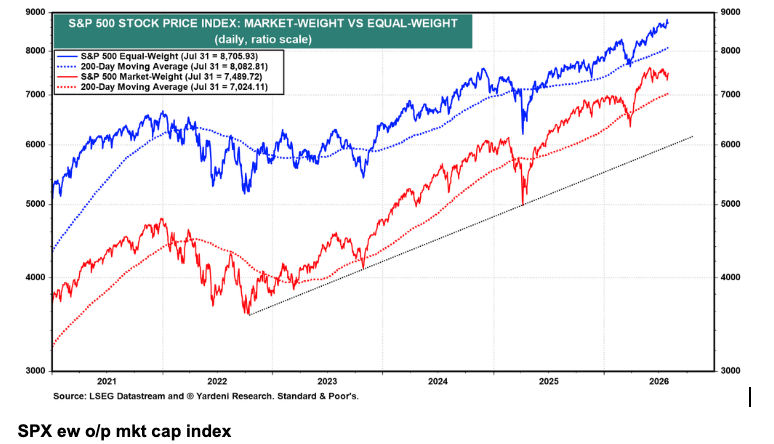
S&P 500 market-weight versus equal-weight: internals stayed constructive.
The macro driver underneath the resilience is the cloud. Alphabet, Amazon, and Microsoft each reported above-consensus revenue, with cloud revenues rising 48% year-over-year in Q2, up from 39% in Q1. That is real, monetised EPS growth outside the circularity of the "other income" lines, and it powered record daily bounces in Microsoft and Amazon.
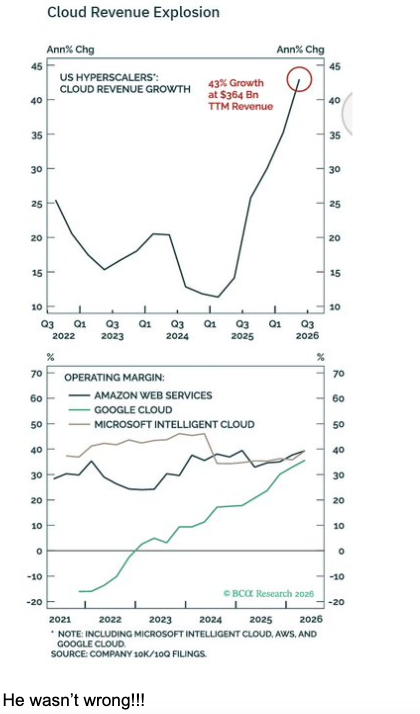
Cloud revenues rose 48% year-over-year in Q2, up from 39% in Q1.
Two signals reinforce the "no recession here" read. US financials extended their run to a record, the XLF up nine weeks in a row, with European financials also at records. You rarely see recessions or tops when financials look this healthy. And on earnings, the indices simply do not look expensive, with broader-market ratings still soft rather than stretched.
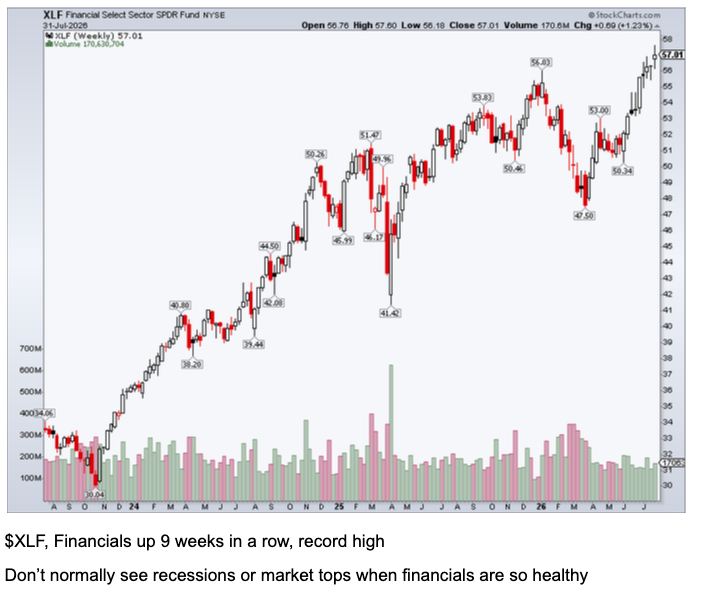
XLF extended its run to nine weeks in a row.
Macro and policy: Warsh wants the market to do the tightening
The Fed sits at the centre, and the framing matters more than the hold. Rates have been cut three times as "insurance," and the long end responded by rising, a paradox in which short rates may need to go up to bring long rates down and reflect a Fed in control. Warsh notes the market is already doing his tightening for him, since most lending is priced off longer rates, and he all but applauded the rise in yields.
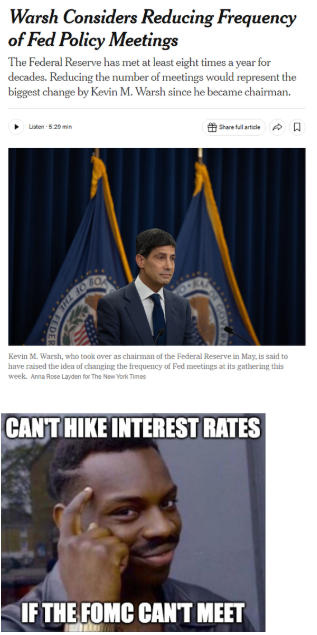
Warsh's first press conference: a hold, with the long end doing the tightening.
The dissent was the story within the story. Hammack, Kashkari, and Logan dissented in favour of a hike, with Musalem signalling he would have joined. The run-up priced roughly a 35% chance of a move, the most uncertainty in three decades, before an anticlimactic hold with no forward guidance. Tellingly, rates rose more after the press conference than during it.
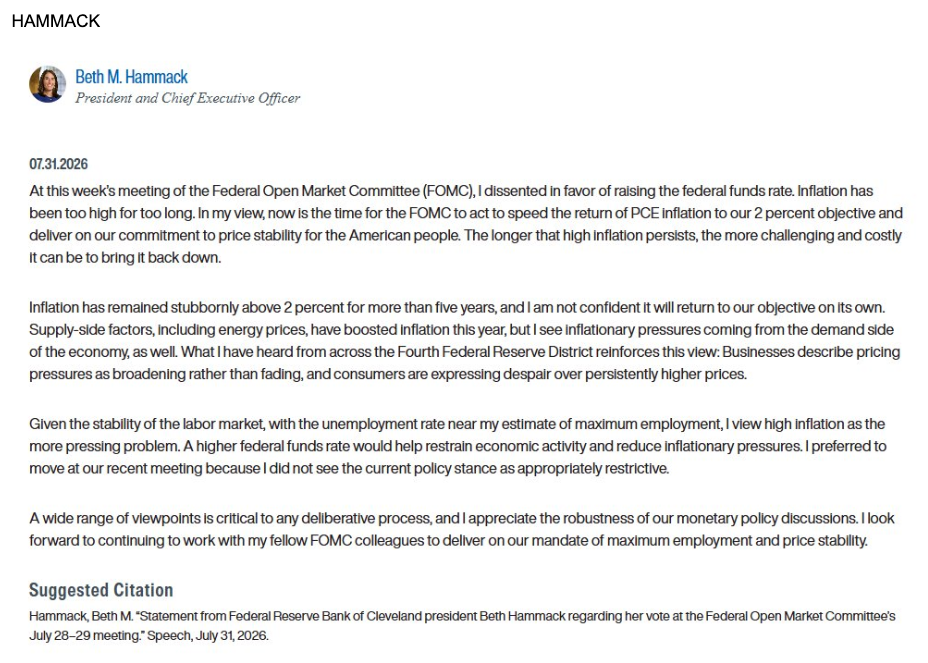
Three FOMC dissenters, the most since 2016, wanted a hike.
Warsh talked like a hawk but held, downplaying AI-related price pressures, tying higher real rates to genuine economic strength, and framing the decision as "watchful thinking, not watchful waiting." The near-term read is data-dependent; research houses still lean toward softer core inflation, keeping the Fed on hold through the rest of 2026.
Watchful thinking, not watchful waiting: the Fed stayed on hold.
The data support a firing economy despite a soft headline. Q2 GDP grew 1.5% annualised, but the miss was traced almost entirely to an 11.5% surge in imports; real final sales to private domestic purchasers accelerated to +3.94%, the strongest since Q1 2023. Inflation cooperated, with core PCE benign at 3.29% year-over-year and the first deflationary monthly PCE print since April 2020, even as the Atlanta Fed's opening Q3 tracker printed a punchy +4.95%.
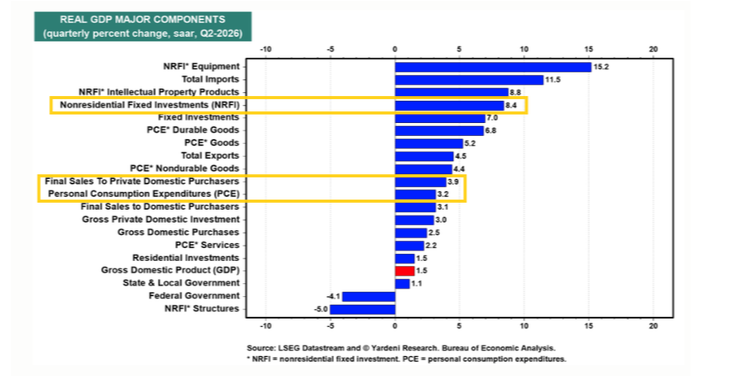
Q2 GDP was 1.5% annualised, with the miss traced to an 11.5% import surge.
The rate backdrop is the pressure point. Ten-year yields ended at their highest since January 2025 and 30-year yields since 2007, yet on a longer history, these sit near median levels. The bond vigilantes have been pushing yields up, saying that if the Fed won't be vigilant, they will, with the 2-year some 75bps above the funds rate.
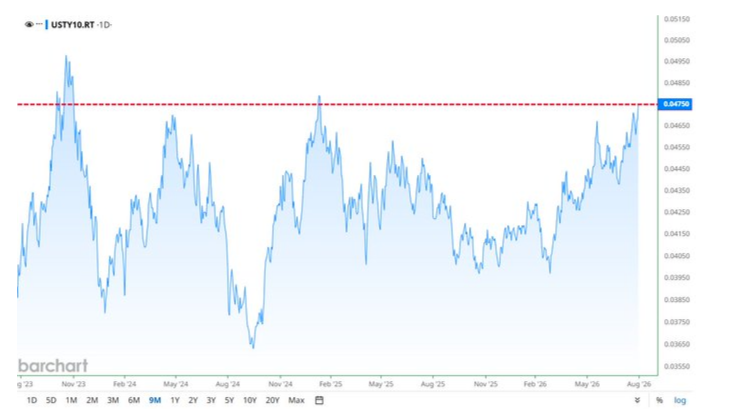
The 10-year ended at its highest since January 2025, the 30-year since 2007.
Overseas added policy risk. The BoE held at 3.75% with three dissenters, but Bailey warned against reading it as "edging toward a hike," and gilts rallied. The BoJ held at 1%, with only Takata seeking a back-to-back rise, while Ueda kept September live; traders see an 89% probability of the next hike by October.
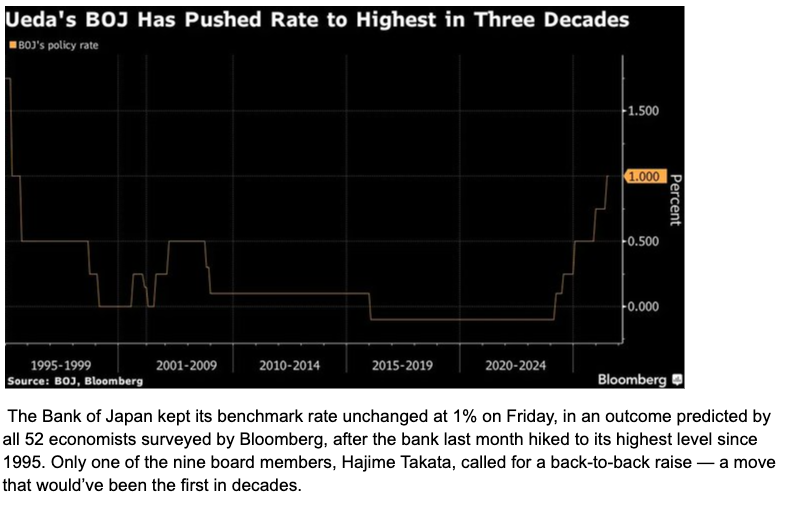
The BoE held at 3.75% and the BoJ held at 1%.
Currencies turned physical. In a coordinated move, the US Treasury had the New York Fed sell euros to buy yen while the BoJ intervened directly, with Bessent's notepad photographed reading "Buy Japanese Yen (JPY) $5-10 bil." The yen surged to its strongest since early May, but without supportive rate differentials, the durability is doubtful; the dollar posted its worst week since January.
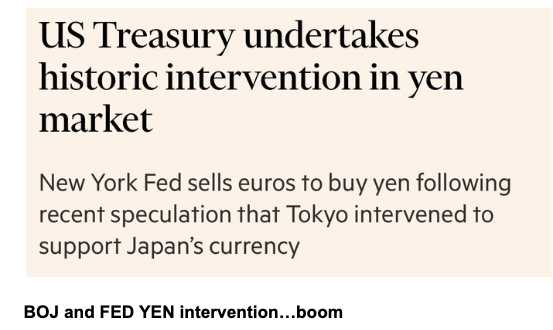
Coordinated yen intervention: NY Fed sold euros to buy yen.
Geopolitics keeps the oil-inflation link alive, with reports of China sending 400 rocket launchers to Iran and Trump ordering fresh attacks, the familiar weekend playbook. Adding to the noise, institutions can now buy faster access to Trump's Truth Social posts for $100,000 a month.
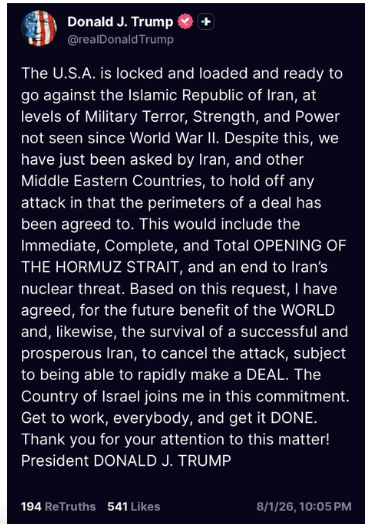
Geopolitics keeps the oil-inflation link alive.
Technical and sentiment: supportive, but increasingly fragile
The fragility starts with the deleveraging that has already happened. Combined margin debt across Korea, China, and Taiwan has fallen roughly $67 billion, with Korea placing curbs on leveraged ETFs after a mini-crash; more than 360,000 Korean margin accounts were forcibly liquidated. This looks close to the end of a deleveraging process, not the start.
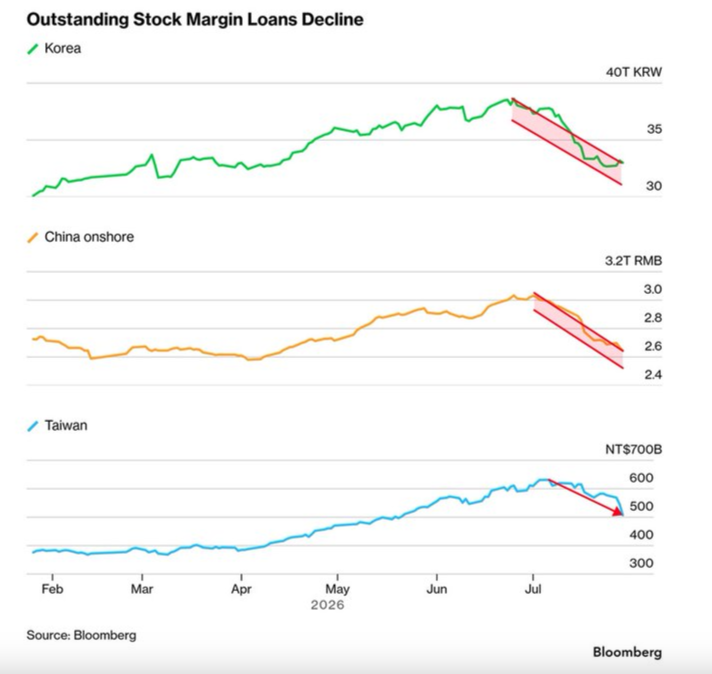
Combined KR, CN and TW margin debt has fallen about $67 billion.
The domestic story rhymes. Retail sold US-listed tech at a record pace, around $316 million on a single Wednesday, the largest daily sale on record, while prime brokers demanded more collateral from concentrated funds. Hedge funds were heavy sellers of tech, then bought back hard once the forced selling exhausted itself: the fingerprint of capitulation feeding a bounce.
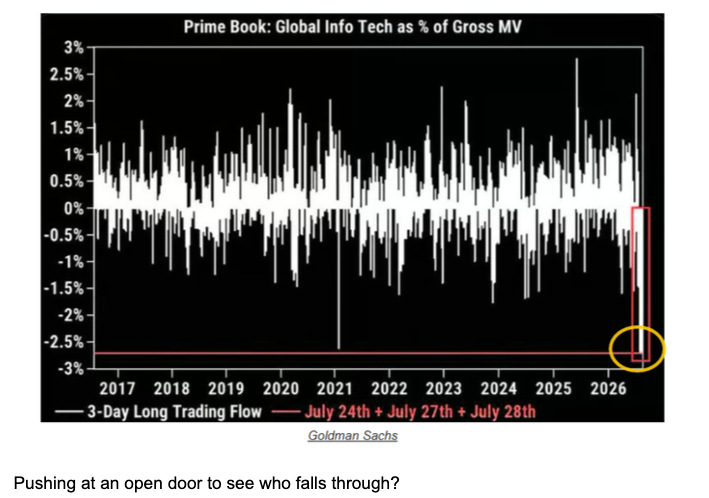
Retail sold about $316 million of US-listed tech on a single Wednesday.
Momentum is where fragility shows most. It suffered its biggest four-day plunge since 2020, then its largest one-day gain since then. Goldman's High Beta Momentum Basket had its worst month since November 2000, down over 24%. The counter is that heavy hedge-fund and ETF deleveraging suggests rotational volatility should now diminish, with positioning back near neutral.
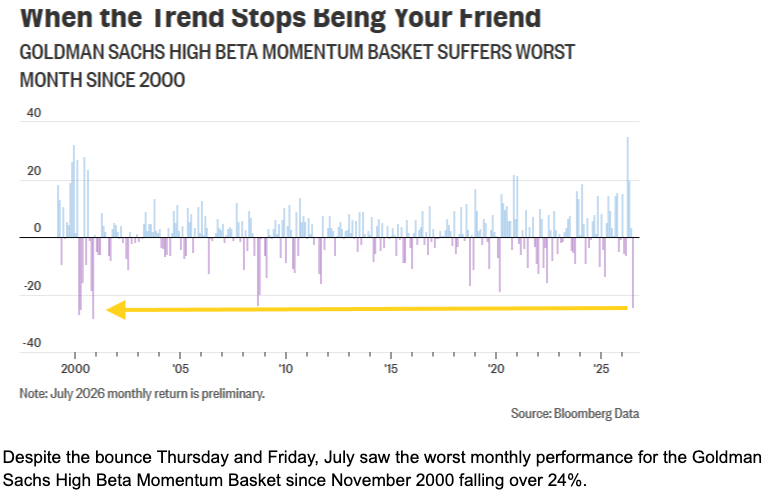
Momentum had its biggest four-day plunge since 2020, then its largest one-day gain since then.
The consensus risk cuts both ways. Bears point to the 11th Hindenburg Omen in three months, lower two weeks later every time since 1970, and G10 excess liquidity turning negative for the first time since 2024. Yet HSBC's Kettner sees the pullback as having erased the sell signal, and flows show money still pouring in, with tech seeing its largest five-week inflows on record.
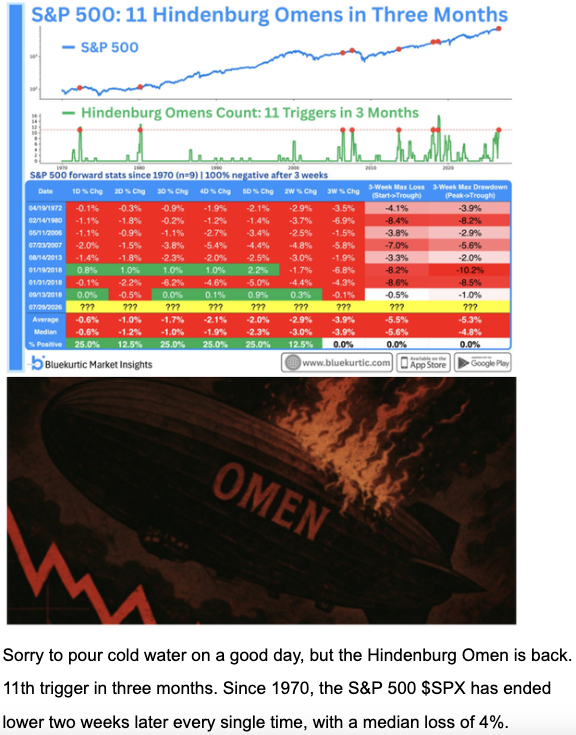
The 11th Hindenburg Omen in three months versus record five-week tech inflows.
Volatility behaviour is the near-term hinge. The VIX carries only a 15-handle but is likely to drift higher into a packed calendar, and as earnings-season dispersion falls, correlations should rise, historically a headwind. Seasonality reinforces caution: a lower June and July is a poor omen, though an S&P up 9%+ through July has finished higher 29 of 31 times since 1950.
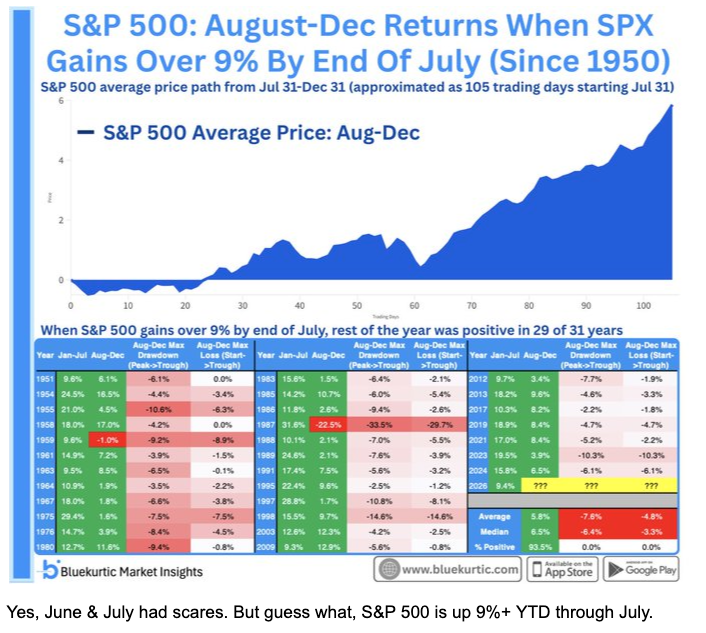
The VIX is still around a 15-handle into a packed calendar.
Last week's recap
Geopolitics, a currency intervention, a hedge-fund blow-up, and a hawkish-sounding Fed all landed in one week, and the market absorbed them, closing higher. Strong earnings, healthy financials, and a leverage washout kept the noise from turning into a broad risk unwind.
Macro
The soft 1.5% Q2 GDP headline masked genuine strength, with the miss traced almost entirely to an import surge rather than weakening demand. Inflation cooperated, with the first deflationary monthly PCE print since April 2020, even as the Atlanta Fed's opening Q3 tracker printed +4.95% and the Chicago Fed saw unemployment edging down to 4.13% ahead of payrolls.
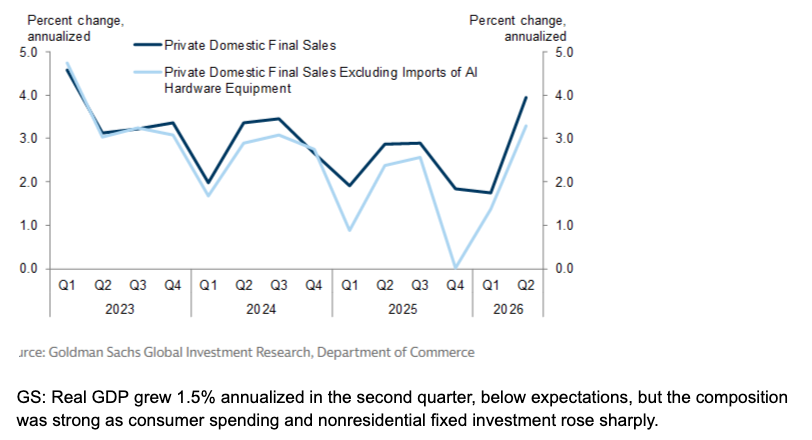
The 1.5% Q2 GDP miss was almost entirely an import surge.
China
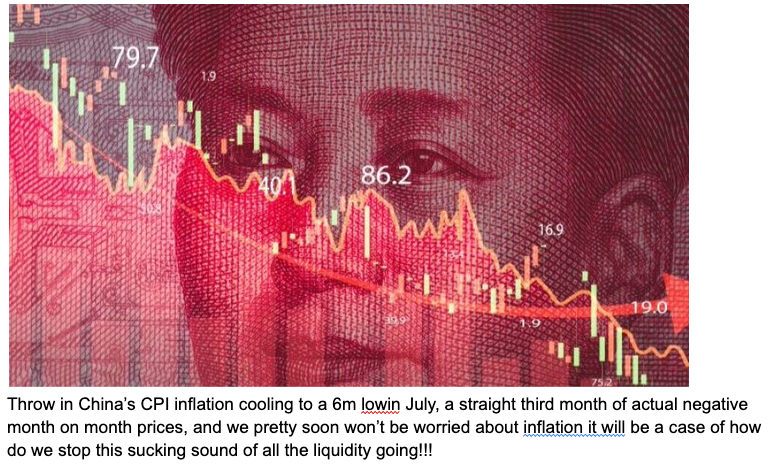
China's momentum slipped again. Factory activity contracted for the first time in five months, with the official manufacturing PMI at 49.2 and construction plummeting to 47, the weakest since the start of the pandemic. The two-speed economy persisted, with high-tech outperforming while consumer goods stayed deep in contraction.
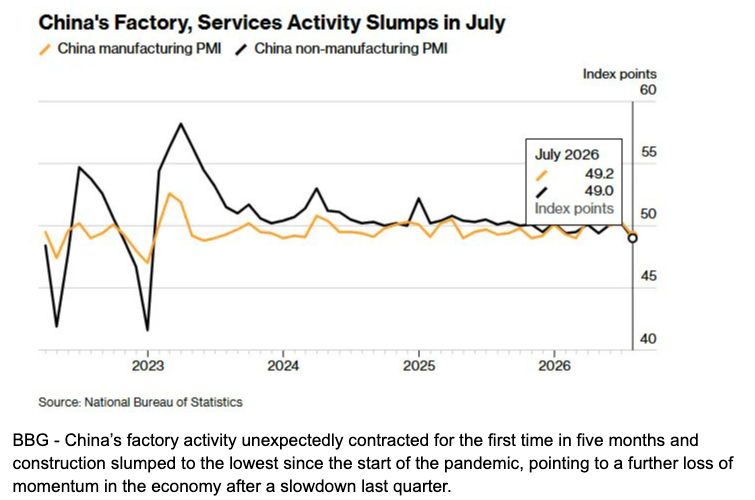
China manufacturing PMI fell to 49.2, with construction at 47.
Earnings
Q2 EPS growth is tracking 37.0% year-over-year, flattered by mega-cap mark-to-market gains, but with Q3 and Q4 rising on their own merits and around 26% ex "other income." The reaction turned selective rather than negative: the weakest results fell about 12.7% on average, while the strongest rose 12.4%, so only disappointments are punished. Amazon had its best day in 14 years and Microsoft its biggest-ever daily market-cap jump.
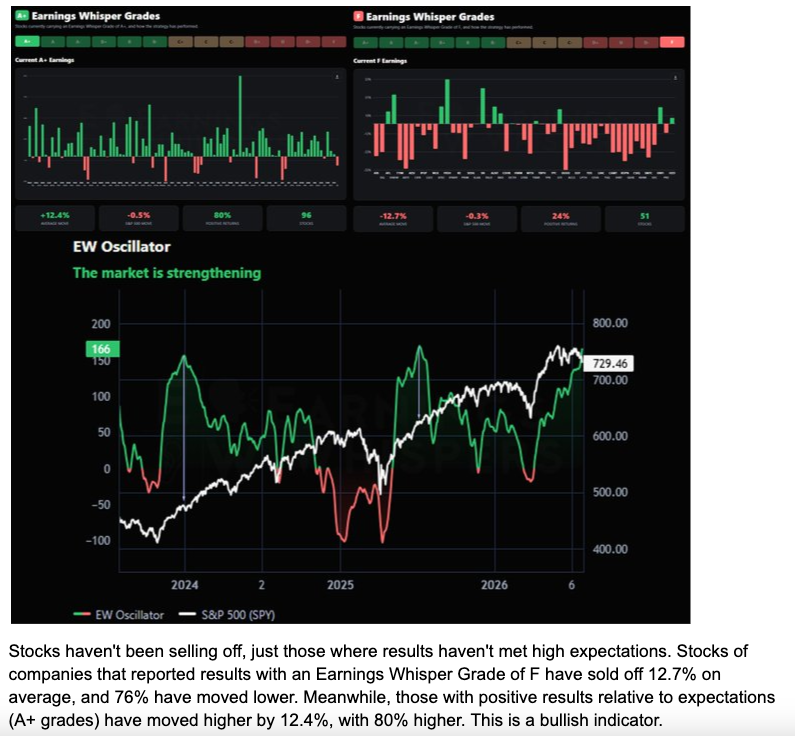
Q2 EPS growth is tracking 37.0% year-over-year, about 26% ex other income.
Commodities
Gold reacted poorly to the post-FOMC real-yield spike, closing below its 200-day moving average for 39 consecutive sessions, the longest since 2022, and holding just above $4,000; $5,000 is still possible by year-end if $4,000 holds, $3,500 the next support if it doesn't. Copper told a healthier story, pressing the top of its multi-year uptrend on AI-infrastructure demand.
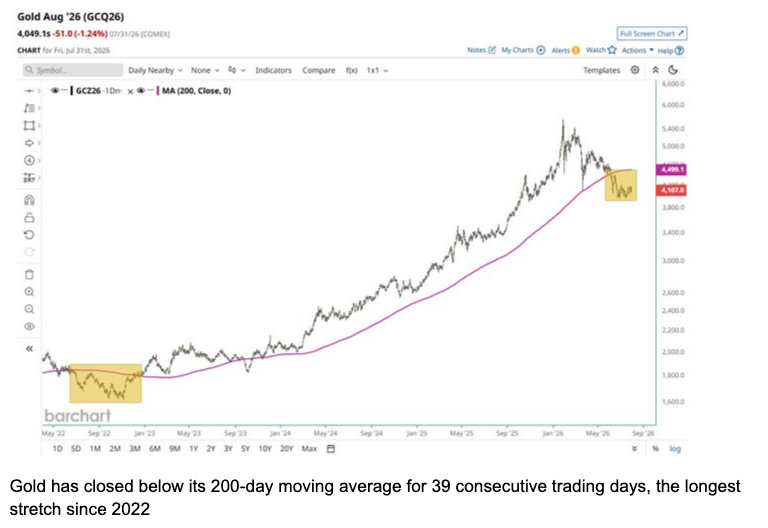
Gold closed below its 200-day moving average for 39 sessions, just above $4,000.
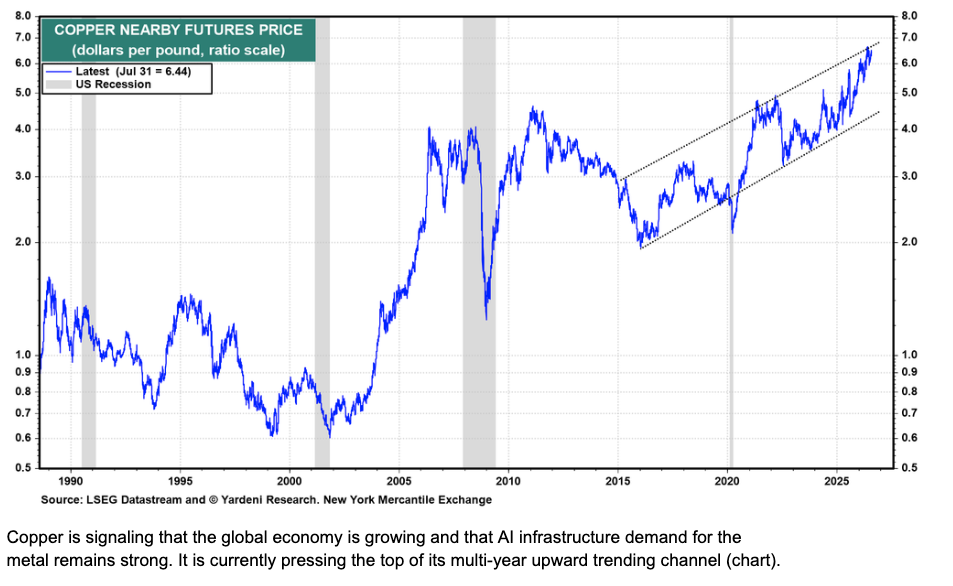
Copper pressed the top of its multi-year uptrend.
Crypto
Crypto was not helped by a fresh security scare. The Coldcard hardware-wallet exploit drained roughly $75-89 million in bitcoin from a legacy 2021 firmware flaw, while a separate Ostium Network attack lost an estimated $18-24 million. Up to three waves saw around $88 million drained, the kind of breach that dents sentiment and could spur the next leg of interest in gold.
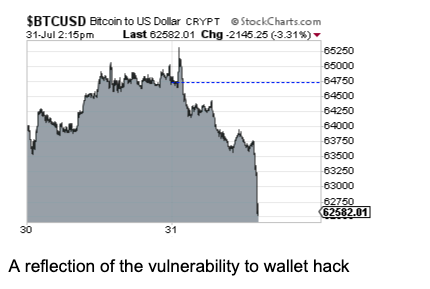
Bitcoin after the hardware-wallet exploit.
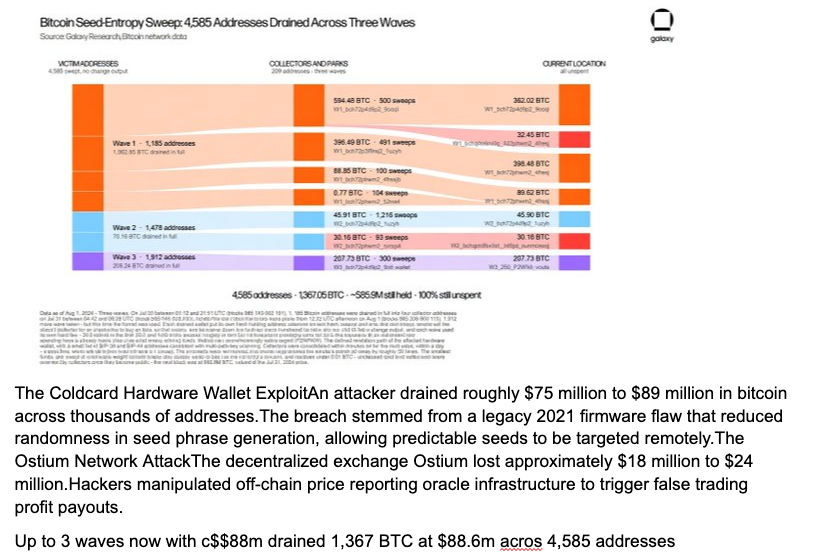
Wallet-security losses across the Coldcard and Ostium waves.
Oil
Oil pushed higher on the intensifying Middle East conflict, with front-month Brent trading as high as $101 before settling around $97, up almost $10 from the prior week's low. The earlier tailwind from falling energy costs has largely evaporated. Technically, crude is still sitting in the mid-range consolidation of the last sell-off, at risk of a breakout, the longer the war footing persists.
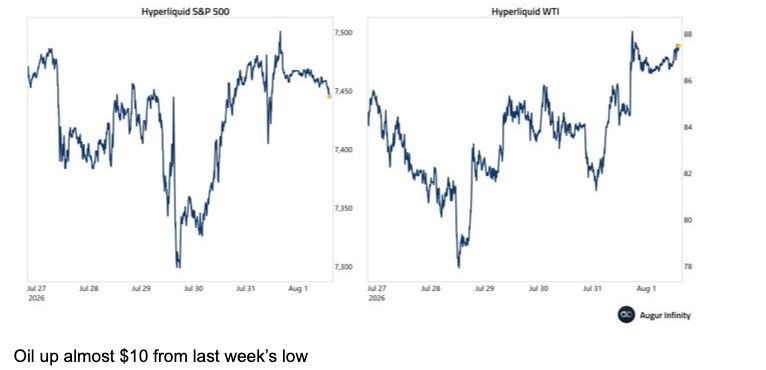
Front-month Brent traded as high as $101 and settled around $97.
The week ahead
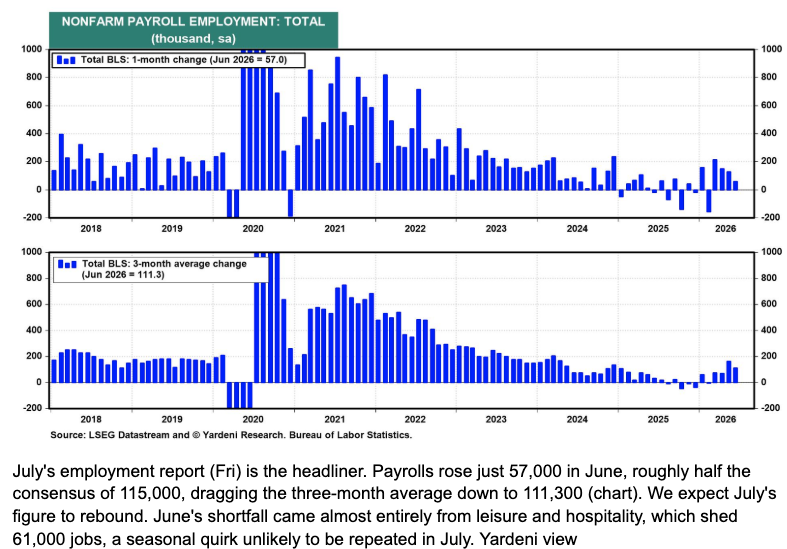
The week is packed with macro, policy, and corporate catalysts. More than 2,600 companies report globally, with the Treasury's Quarterly Refunding Announcement opening on Monday and July payrolls closing it on Friday. Chips, drugs, and rockets headline the tape, led by Palantir, AMD, Eli Lilly and SanDisk, while SpaceX makes its first earnings announcement as a public company on Tuesday.
Monday, August 3
- US: ISM Manufacturing PMI
- US: S&P Global Manufacturing PMI
- US: Construction Spending
- US: Atlanta Fed GDPNow
- US: Senior Loan Officer Survey
- US: Treasury Quarterly Refunding Announcement
- Eurozone: Manufacturing PMI
- China: RatingDog Manufacturing PMI
- India: HSBC Manufacturing PMI
- Earnings: Palantir
Tuesday, August 4
- US: JOLTS Job Openings
- US: Trade Balance
- US: Factory Orders
- US: Total Vehicle Sales
- US: API Weekly Crude Oil Stock
- Korea: CPI
- Japan: 10-Year JGB Auction
- Earnings: AMD, SpaceX
Wednesday, August 5
- US: ADP Nonfarm Employment Change
- US: ISM Non-Manufacturing PMI
- US: S&P Global Services PMI
- US: MBA 30-Year Mortgage Rate
- US: EIA Crude Oil Inventories
- US: Fedspeak, Cook and Daly
- India: RBI Interest Rate Decision
- Eurozone: PPI
- Brazil: Interest Rate Decision
- Earnings: SanDisk, Eli Lilly, Western Digital, Shopify
Thursday, August 6
- US: Challenger Job Cuts
- US: Initial Jobless Claims
- US: Nonfarm Productivity
- US: Wholesale Inventories
- US: Atlanta Fed GDPNow
- Germany: Factory Orders
- Eurozone: Retail Sales
- Japan: 30-Year JGB Auction
- Earnings: ConocoPhillips, D-Wave
Friday, August 7
- US: Nonfarm Payrolls
- US: Unemployment Rate
- US: Average Hourly Earnings
- US: Participation Rate
- US: NY Fed 1-Year Inflation Expectations
- US: Baker Hughes Rig Counts
- China: Trade Balance
- France: Q2 Unemployment Rate
- Canada: Employment Change
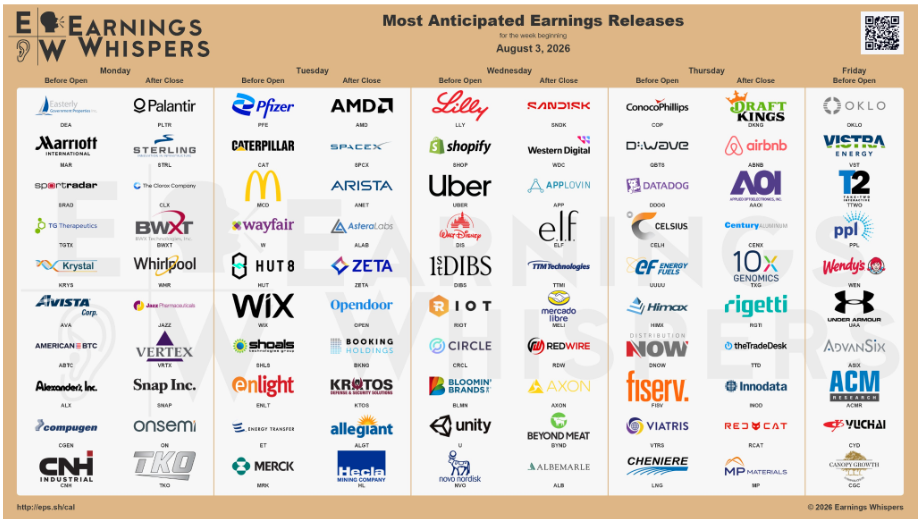
Most anticipated earnings for the week beginning August 3.
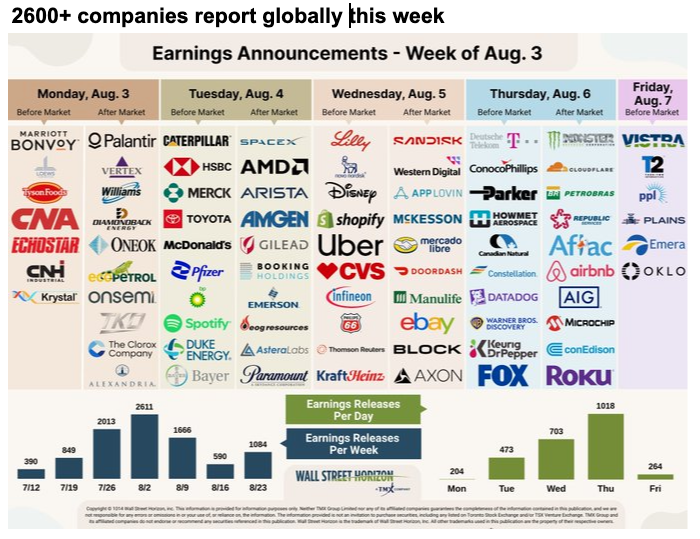
The week-ahead calendar from the pack, first chart.
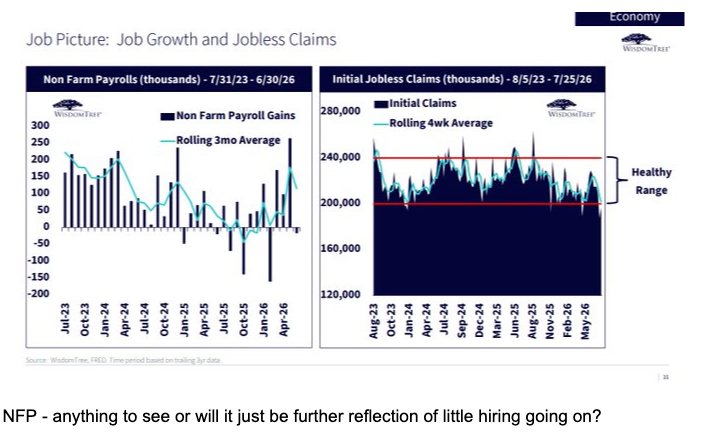
The week-ahead calendar from the pack, second chart.
The week-ahead calendar from the pack, third chart.
Takeaway
The momentum pullback looks to have run its course on the back of a forced-liquidation event, with Asia deleveraged, hedge funds buying back tech, and cloud earnings doing real work, but early-August seasonality, stretched sentiment, and yields at range ceilings all argue for care rather than conviction.
Equities
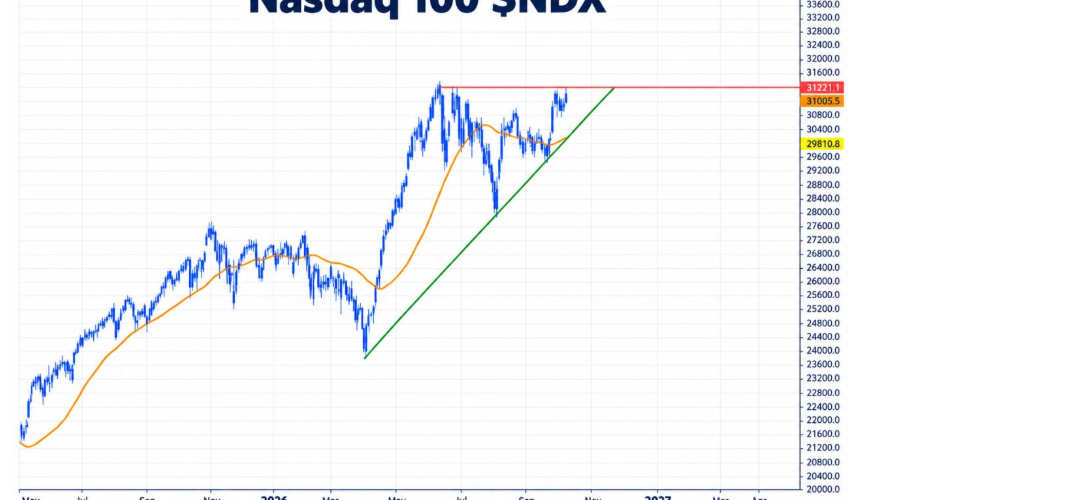
The structure stays constructive: earnings outside the "other income" boosts are still beating with high frequency, outer years are being revised up, and PE ratings are soft rather than bubble-like. The NAS100 bouncing off its 20-day is usually enough to start the next leg, but with earnings season ending, pushing correlations up, and no MAG7 on the calendar, it feels like a two-way pull.
Gold and silver
Gold reacted poorly to the yield sulk and is wrestling with higher real rates and slowing excess liquidity. Underlying inflation models are benign, which is supportive medium-term; the near-term caution is that gold doesn't slip toward major support around $3,500, though on balance it should hold.
Crypto
Crypto is struggling with low liquidity and did itself no favours with the wallet exploits. The soft-liquidity backdrop leaves it more vulnerable than equities, and continued weakness is part of what could keep relative preference tilted toward gold.
Macro
Oil remains the key link between geopolitics, inflation, and central-bank expectations, still mid-range but at breakout risk. The dollar is weaker after the yen intervention but has to fight a largely priced-in September hike, while the Fed stays firmly data-dependent, "watchful thinking, not watchful waiting."
There are enough warnings, foreign inflows at tops, poor seasonality, BofA calling a retreat, to justify respect, even as the bulls argue the market has done enough to look up again. The leverage looks put to bed, and enough stocks across enough sectors are delivering that fundamentals can keep carrying the tape. Tread carefully, but resist turning super-bearish after the move.
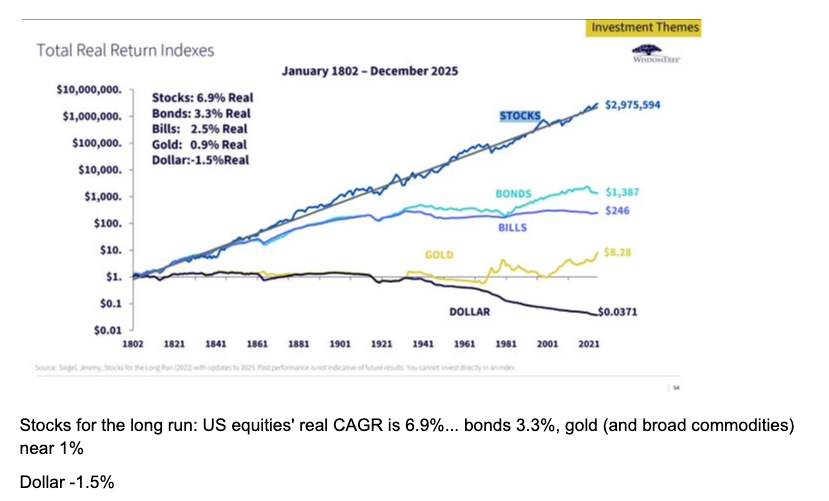
Closing chart from the August 3 pack.
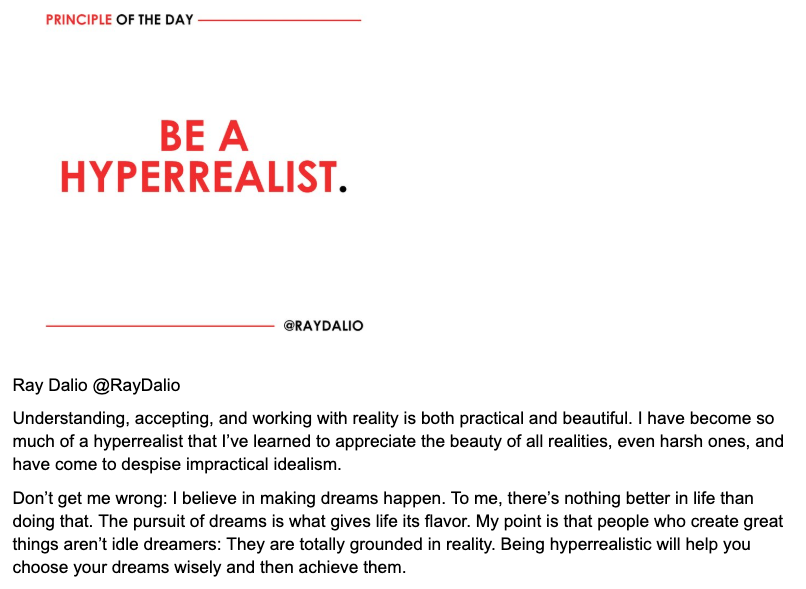
Second closing chart from the August 3 pack.
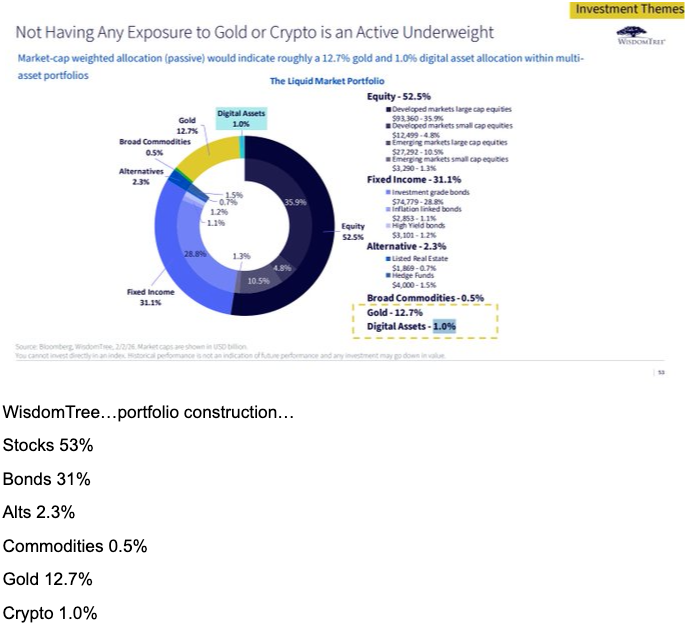
Third closing chart from the August 3 pack.
Charts and figures are from the 3 August 2026 weekly pack. This is a recap of that tape. It is not a personal recommendation, and nothing in it is guaranteed.