The 30-year yield met the 5.3% line the desk has marked for Treasury, Scott Bessent doubled long-bond buybacks, and Brent's spike through $93 got in the way. Gold broke $4,600. The S&P spent the week in a holding pattern ahead of Nvidia and Jackson Hole. This is a market recap, not a recommendation to buy or sell. The note went out late, so Monday 24 August is included as the start of this week.
Market overview
The S&P 500 had a choppy week, down about 1.6%. It dipped toward 7,650 and closed around 7,675. The chart treats 7,650 as a test of the 50-day, and marks a holding range between 7,620 and 7,780. Equal-weight beat the cap-weighted index, so the drag sat in the mega-caps. The desk's read of that range is a pause.
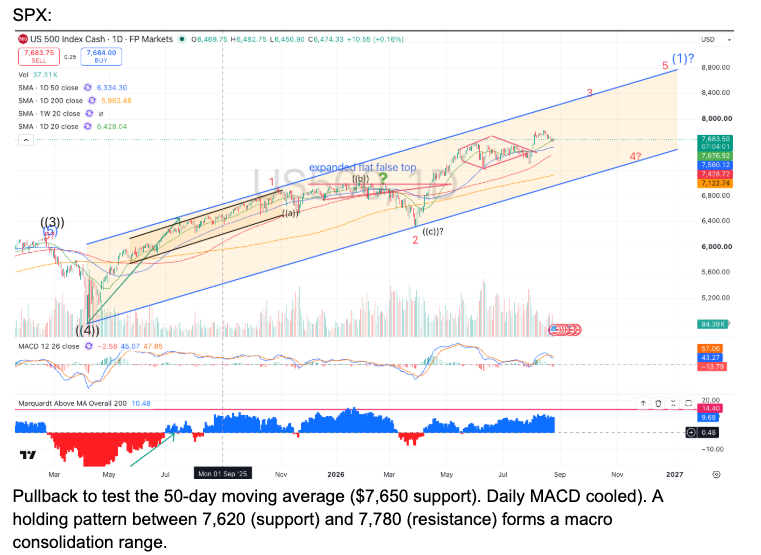
S&P 500 daily. The desk has support at 7,650 on the 50-day, and a range of 7,620 to 7,780.
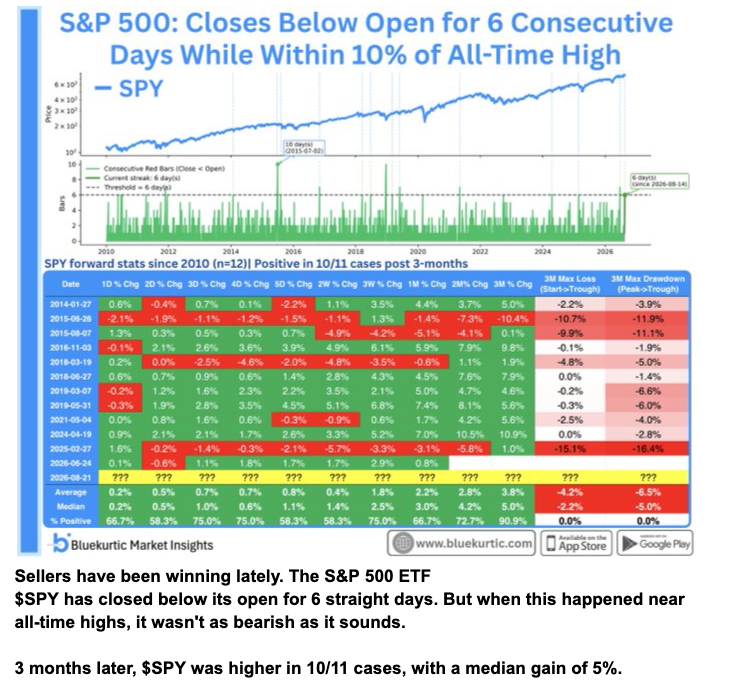
The same index, on the desk's other chart. The label on it is a pause, not a break.
The Nasdaq-100 came off early-week highs near 26,640, with semiconductors down about 2.8% on the week. On the 4-hour chart it is stuck in a cluster of moving averages after a bounce off the 23.6% retracement. The last print on that chart is 25,740.8, down 1.26% on the session shown. A possible head-and-shoulders sits on that timeframe. The desk has the neckline near 26,200, and a move back above 26,800 as the level that would cancel the pattern.
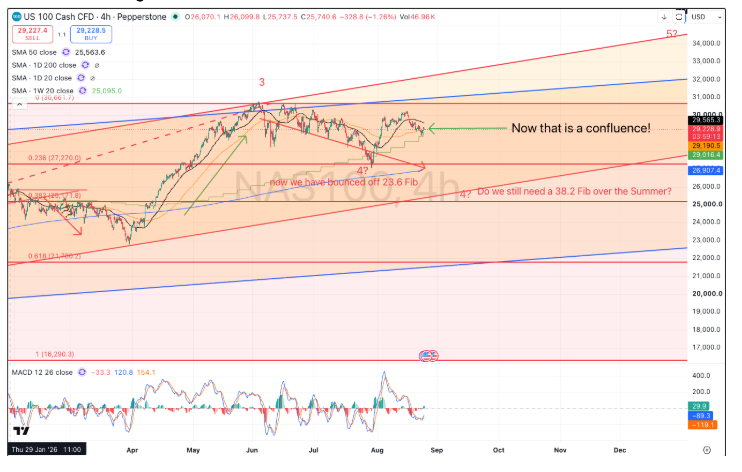
Nasdaq-100, 4-hour. Last print 25,740.8, caught between the moving averages after the 23.6% bounce.
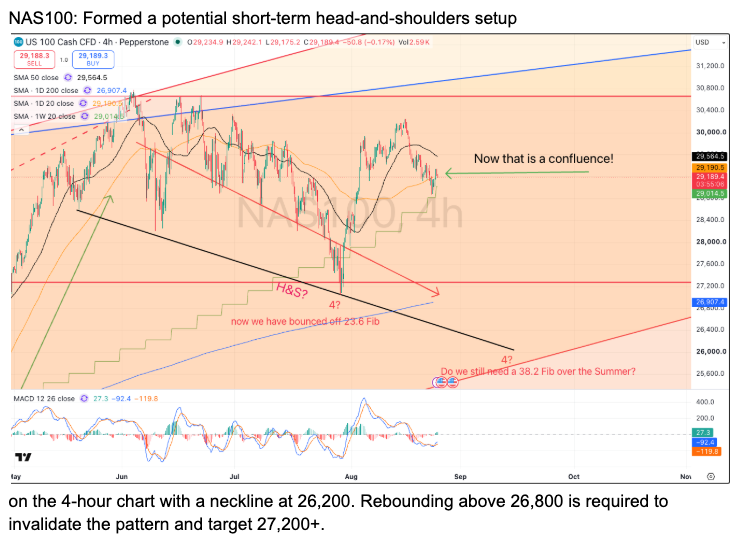
Nasdaq-100, with the downward-sloping head-and-shoulders the desk has flagged. Neckline near 26,200.
The Russell 2000 held its relative-strength trend, with the bull flag the desk has marked above the 20-day, in the $302 to $304 zone. A break above $308 is the expansion level on that chart. Monday 24 August opened under pressure and then turned: the S&P was up about 0.43% near 7,674, the Nasdaq-100 about 0.43% near 26,180, and the Dow about 0.98% near 53,277. Samsung fell 8.7% overnight on a capital-return disappointment, and Alibaba fell 9.8% on a capital raise.
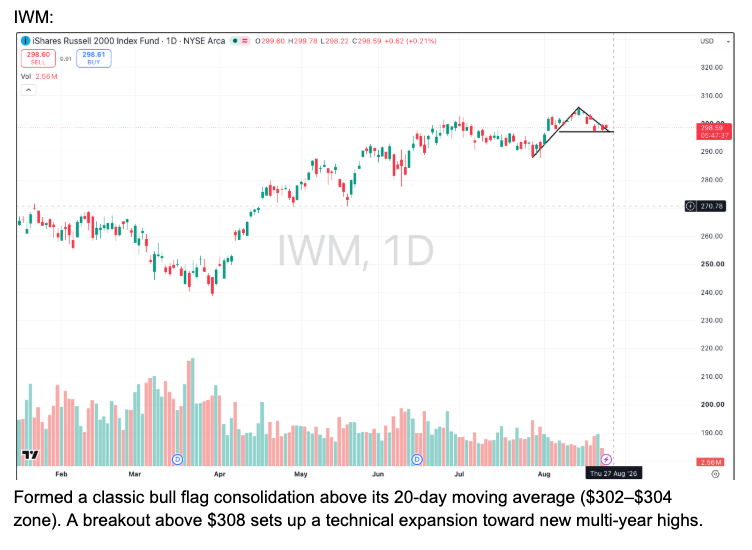
Russell 2000 / IWM. The desk has a bull flag above the 20-day, in the $302 to $304 zone.
Sector dispersion was wide. Gold miners led the board on the desk's screenshot, with GDX the top line. Semiconductors sat at the bottom. For the week itself the desk has GDX up 11.9%, from $91.89 to above $102, and energy as the strongest standard sector, up 7.33%. The screenshot is a shorter window than that weekly tally, which is why XLE looks almost flat on it while GDX is still the line that ran.
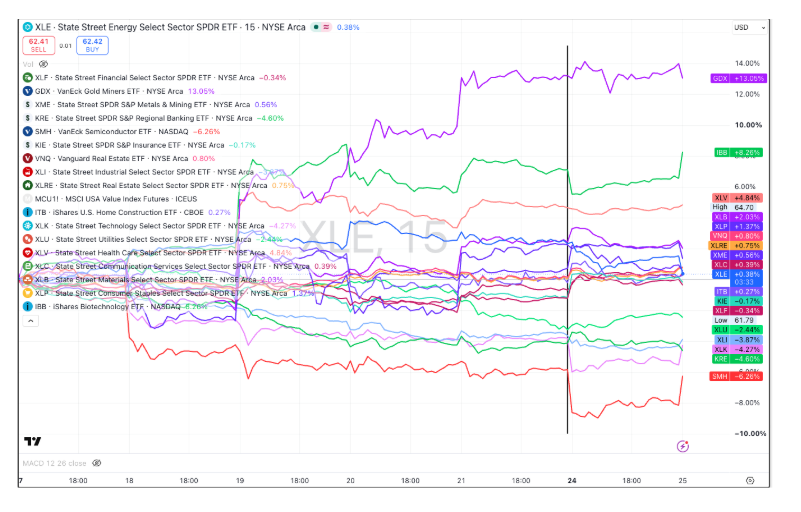
US sector board on the desk's screenshot. Gold miners lead. Semiconductors (SMH) are at the bottom.
The 30-year, and the buyback
US national debt has touched $40 trillion. The 30-year spiked to about 5.30% on 18 August. On the chart, 5.3% is marked as Treasury's line in the sand, and the latest close is 5.184%. Momentum on that chart has no obvious peak. July's FOMC minutes, out on Wednesday, showed three officials leaning toward a 25bp hike. That took near-term cut pricing down before Treasury stepped in.
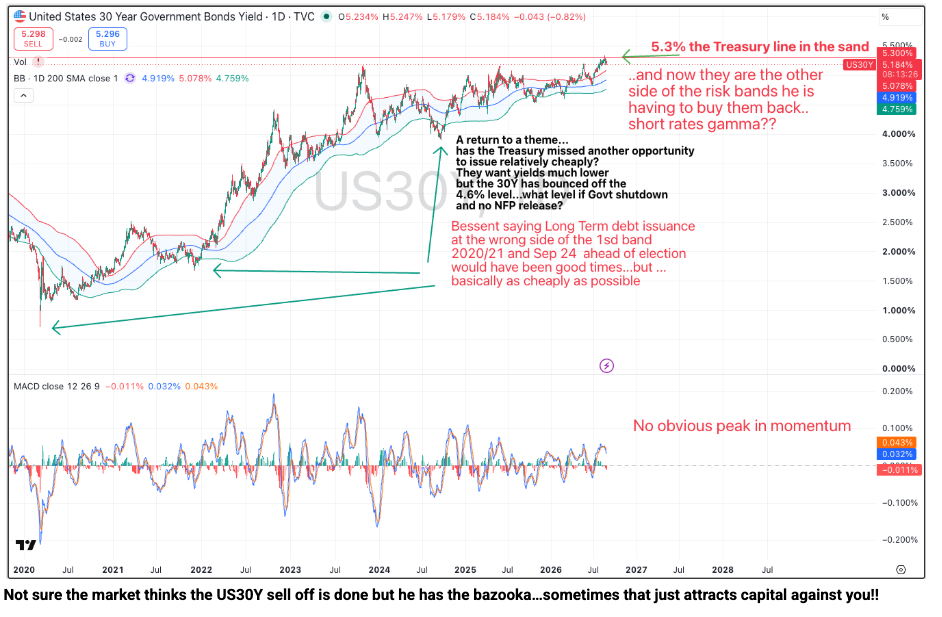
US 30-year yield, latest close 5.184%. The desk has 5.3% marked as Treasury's line in the sand.
The Fed already owns the long middle of the curve. Of Treasuries maturing in 10 to 15 years, $540 billion of $1,028 billion, 53%, sat on the Fed's book as of 12 August. Shorter buckets are in the mid-teens or lower. That is the stock Bessent is trying to lean against with buybacks, not a blank sheet.
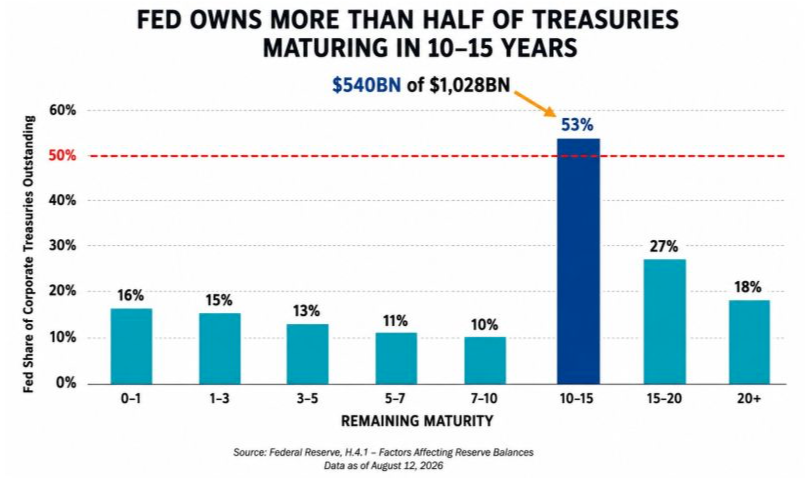
Fed share of Treasuries by remaining maturity, as of 12 August 2026. The 10-15 year bucket is 53%, $540 billion of $1,028 billion. Source: Federal Reserve H.4.1.
On 19 August Bessent said Treasury would at least double long-dated buybacks, from $2 billion to $4 billion-plus an operation, starting 9 September. The 30-year dropped from about 5.32% to 5.18% on the headline. By Thursday it was back near 5.27%, and the 10-year rose 4bp to 4.67%, as Brent went through $93. The overlay chart has that session at a high of $93.97 and a close of $90.53, down 2.62%, with the 10-year at 4.66%. The note on the chart is that buying bonds back while oil is spiking tends to get filled in size.
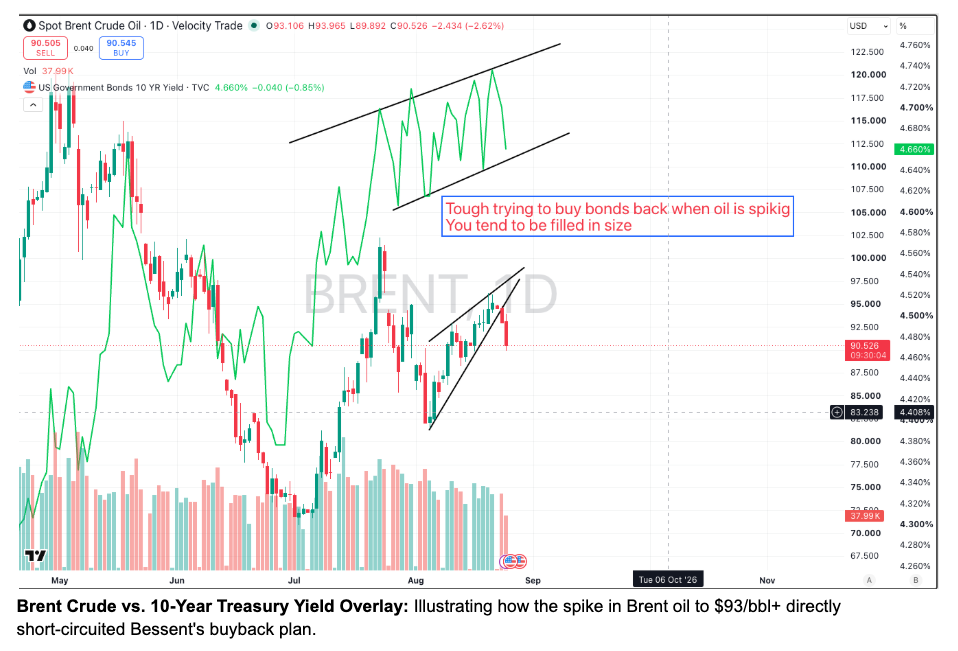
Brent versus the US 10-year. Brent spiked through $93 and closed the session at $90.53. The 10-year was at 4.66%.
A note from Sunil Reddy sets out how the cash would move. Treasury is looking at the Treasury General Account, about $1 trillion at the Fed: buy the long end from cash already raised, let the account fall, and refill it later with bills. The Fed is not creating those reserves. The debt stock does not shrink. Duration moves from long bonds toward bills, and the refinancing comes back as short-term funding. The desk's own line on it is that Bessent will frame this as a curve trade, with two risks attached: a short-term spike in yields, and the longer read that Treasury is monetising the debt.
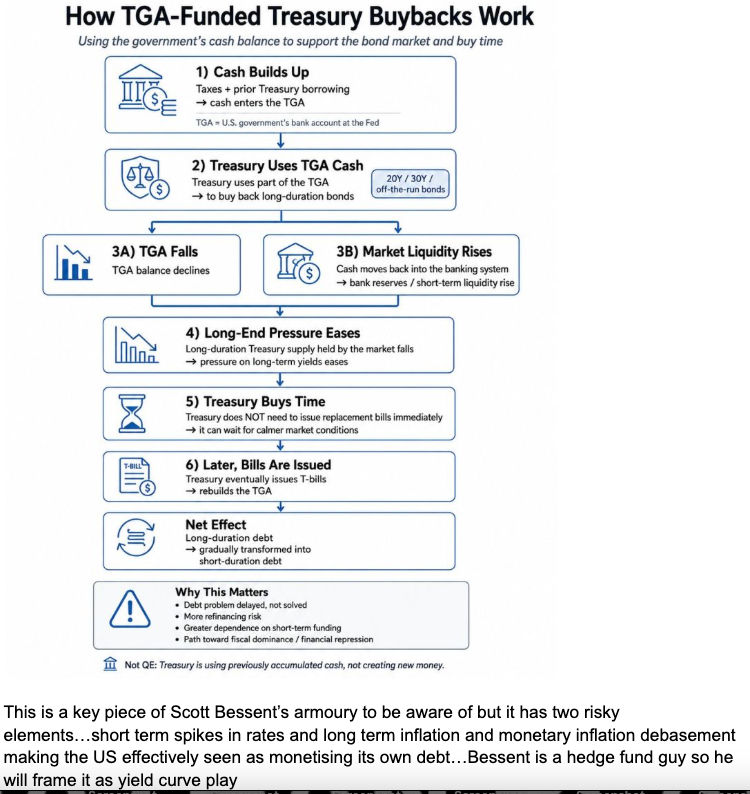
How a TGA-funded buyback would work: cash already at the Fed buys long bonds, bills refill the account later. The chart's own footer says this is not the Fed creating money.
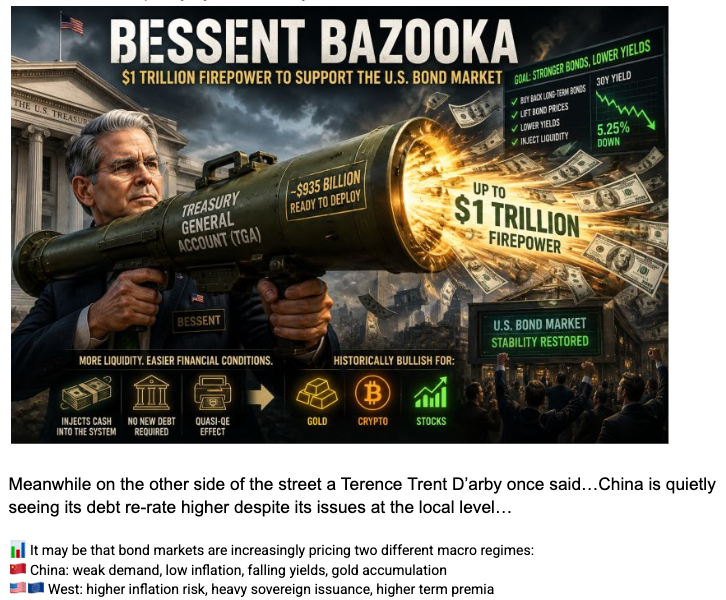
The desk's illustration of the same buyback, using the Treasury General Account as the firepower.
Foreign official demand for T-bills has already swung to net selling on the Reuters chart dated 18 August. Credit has been moving with the bond market. Broadcom's CDS was at 126 and Nvidia's at 87 on the desk's chart, both described there as all-time wides. That is the semiconductor financing question landing in the same week as the buyback.
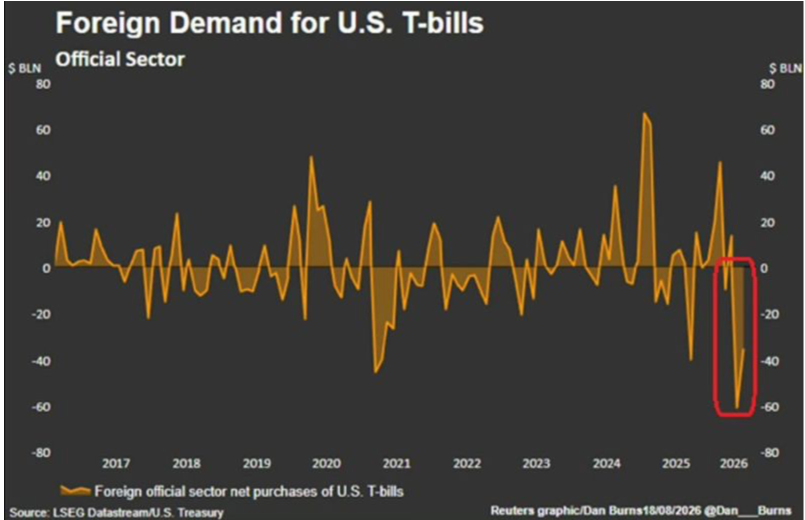
Foreign official net purchases of US T-bills. The latest readings are net sales. Source: LSEG, US Treasury, via Reuters.
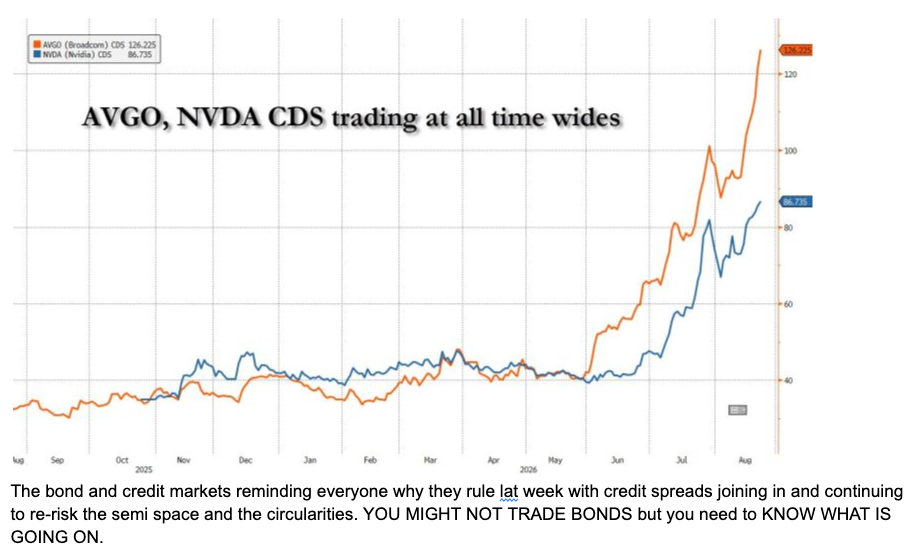
Broadcom CDS at 126, Nvidia CDS at 87. The desk has both at all-time wides.
The other chart in the pack asks whether 5% is a panic or a return to a longer average. As of the 18 August close, the 30-year nominal yield on that chart is 5.28%, and the real yield is 2.76%. The 1977-2026 average nominal yield is 6.16%. Against 2000-07, today's nominal yield is about 11bp above that era's 5.17%, and the real yield is 2.76% against that era's 2.48%. The 2009-21 average, at 3.04% nominal, is the low one.
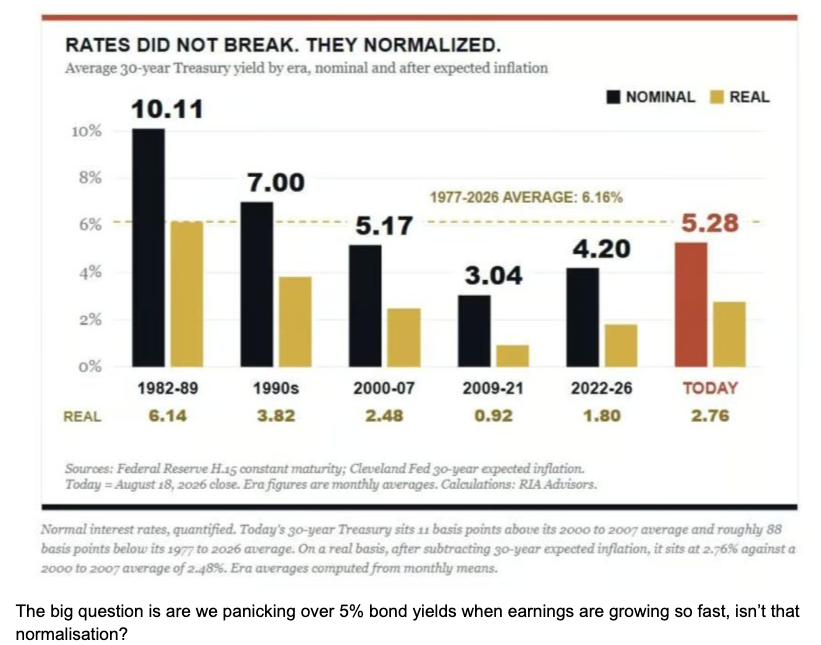
Average 30-year yield by era. Today, as of 18 August: 5.28% nominal, 2.76% real. Source: Federal Reserve, Cleveland Fed, RIA Advisors.
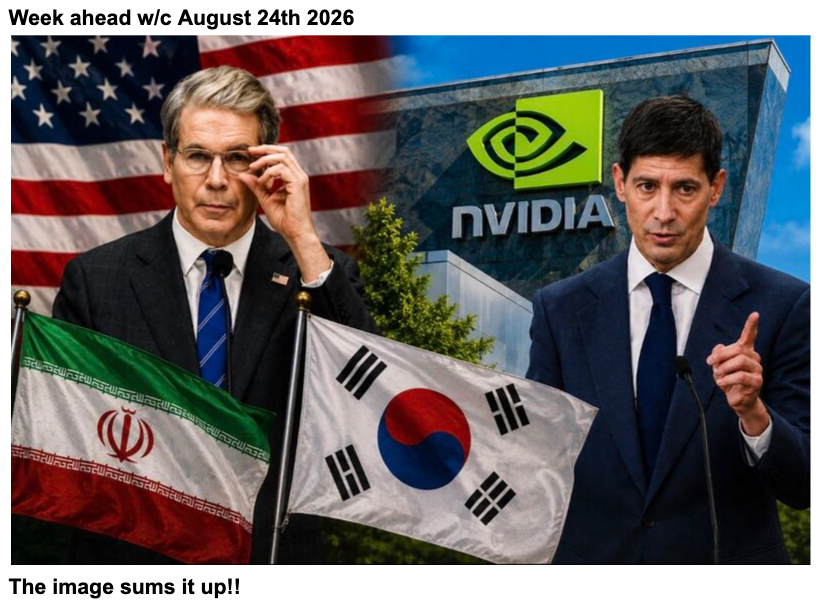
The desk's card for the week: a hard one for Bessent and for Chair Warsh.
Oil, Hormuz, and the dollar-system warning
The oil bid is a shipping story as well as a price story. A report the desk clipped has traffic through the Strait of Hormuz up nearly 400%, with Iran's hold on the waterway described as weaker: 103 ships entered over seven days and 89 exited. At the same time, crude loadings out of Sohar in Oman and Fujairah in the UAE have jumped on the Bloomberg departure chart. Oil is finding routes that do not rely on the old pattern.
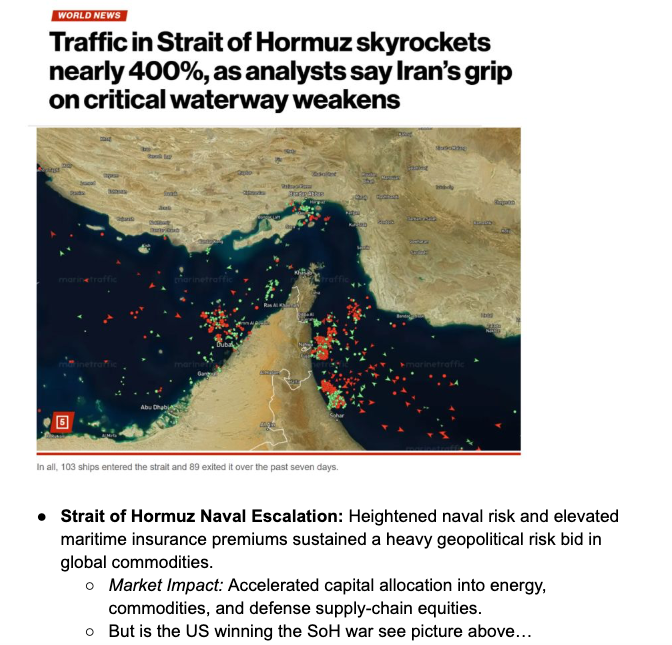
Strait of Hormuz traffic. The clipping has volumes up nearly 400%, with 103 ships in and 89 out over seven days.
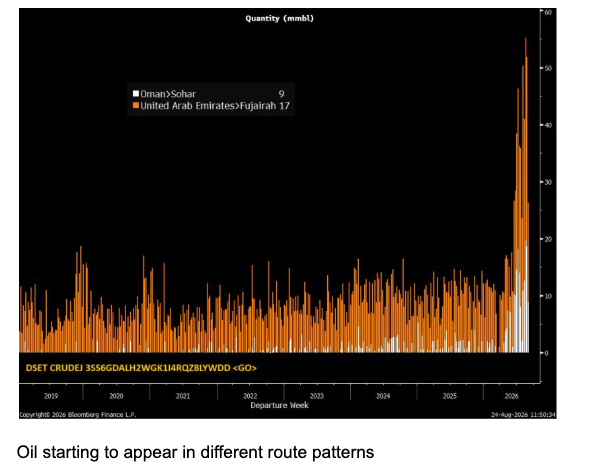
Crude loadings out of Sohar and Fujairah. The 2026 bars are the break with the old pattern. Source: Bloomberg.
Bessent has warned that banks and governments doing business with Iran could be cut out of the dollar system. The desk's note under that is China's role: about 90% of Iran's oil exports go to China, and the August run-rate the note cites had slowed from about 823,000 barrels a day in July to 534,000, without stopping. Beijing's public line is that sanctions are not the solution. The desk's question is whether that becomes a financial argument between Washington and Beijing, and whether more official buying shows up in gold because of it. Canada is the other trade shock in the pack. A 50% US tariff on about $20 billion of Canadian imports took effect on 19 August, and the Canadian dollar lagged the crude rally.
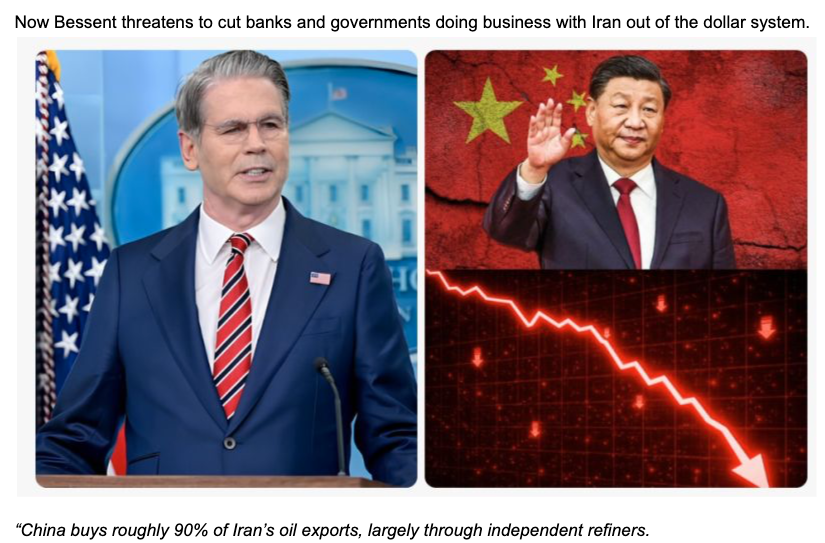
The desk's chart on who gets picked: Iran-linked business, and the threat of being cut out of the dollar system.
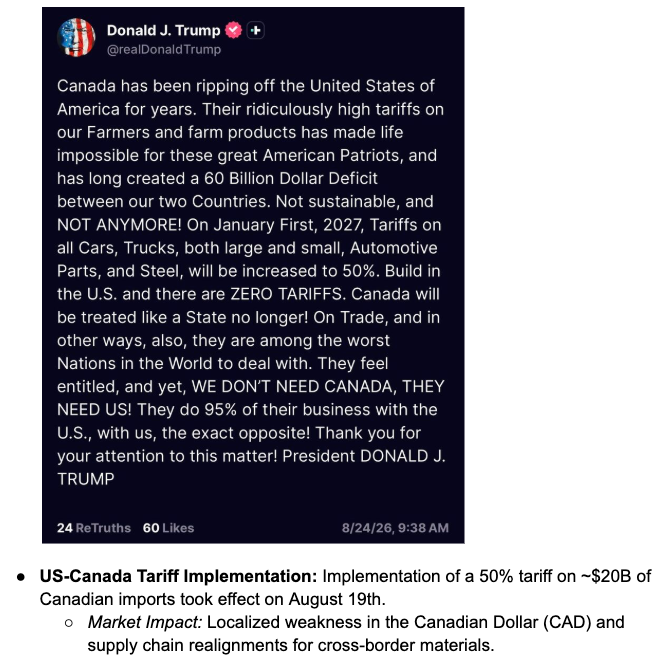
Canada, after the 19 August tariff on about $20 billion of imports.
Gold and the dollar
Gold went through $4,600 after the buyback headline. The desk had it near $4,680 by the end of last week, and the Monday note had a further push that touched $4,700. On the daily chart the last marked close is $4,586, with quotes around $4,623. The 50-day is at $4,245. The note on the chart puts $4,400, the old ceiling, as the level underneath, and $4,720 as the next band. Goldman's year-end figure is $4,900, on central-bank buying and a recovery in Western ETF demand. That is their forecast.
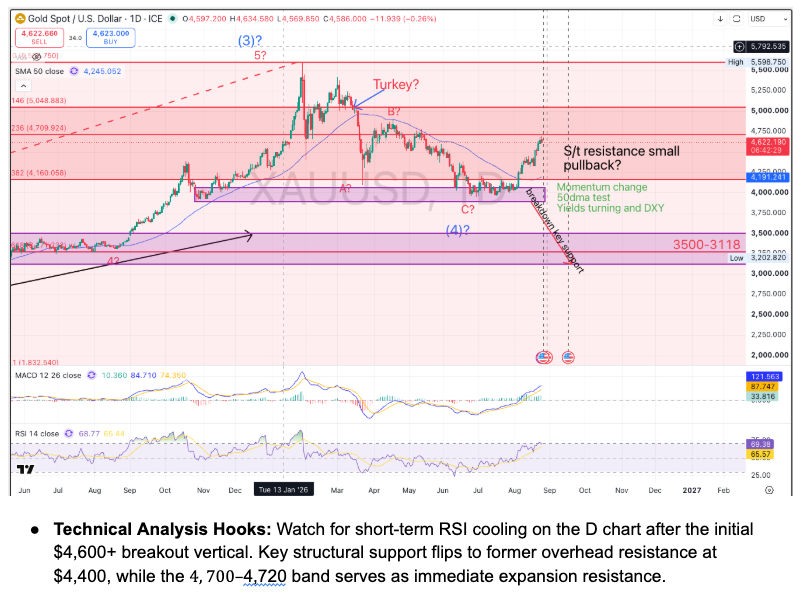
Gold daily. Last marked close $4,586, 50-day at $4,245. The desk has $4,400 as support and $4,720 as the next band.
The allocation chart next to it is Advait Arora's arithmetic, which the desk pasted in. Global financial wealth about $333 trillion, above-ground gold about $31 trillion. A one-point rise in the portfolio weight is about $3.3 trillion, set against roughly $555 billion of total gold demand in 2025, which the chart calls about six times a year's demand. Central banks bought 863 tonnes in 2025 on that graphic. Mine supply growth is shown at about 1-2% a year. The separate clipping compares the 2022 freeze of Russian reserves with Bessent's Iran warning, and treats gold as the asset that rallied the last time the dollar system was used that way.
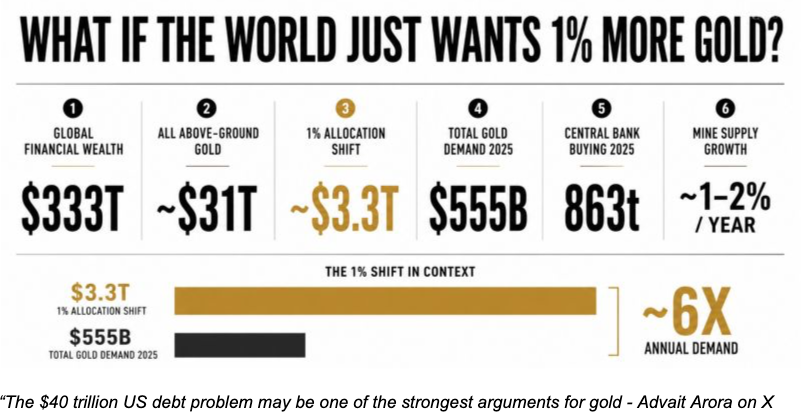
A 1% rise in gold's portfolio weight, on the desk's clipping: about $3.3 trillion, against about $555 billion of 2025 demand.
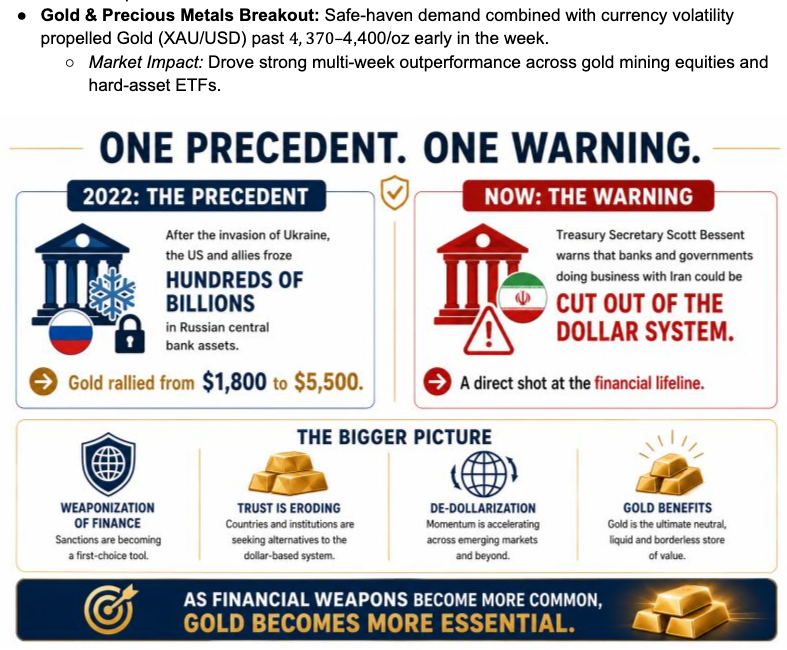
The desk's clipping: the 2022 reserve freeze next to the warning on cutting Iran-linked business out of the dollar system.
The dollar index closed at 98.95, under the 200-day at 99.17. The 50-day is up at 100.50. The annotation calls it a poor week for the dollar. EUR/USD held near 1.1590. Cable pushed toward 1.3560, with UK services inflation still keeping Bank of England cuts priced a long way out. USD/JPY was near 159.10. Japan's 10-year hit 2.94%, a 30-year high for that yield, after second-quarter GDP of 2.0% year on year. The Swiss franc is the carry the desk has marked as the one that has been paying.
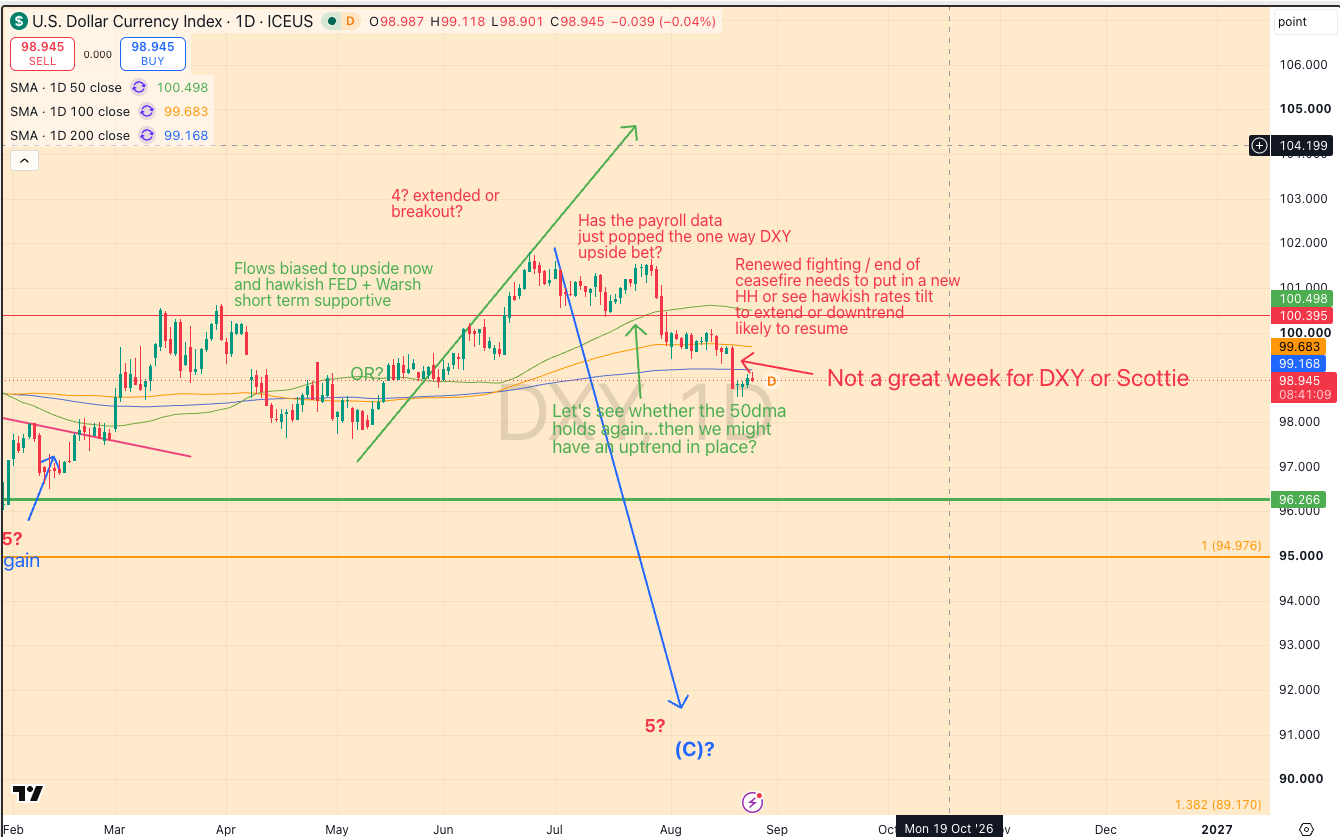
Dollar index at 98.95, under the 200-day at 99.17. The 50-day is at 100.50.
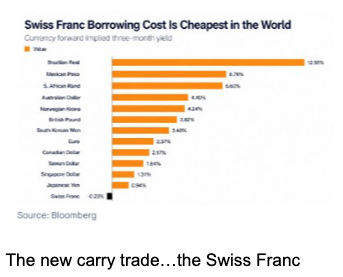
Swiss franc, the carry the desk has flagged as the winner.
Bitcoin traded with the same bid. On the desk's account it ran from about $63,370 to above $79,500, then settled in the high $70,000s. The ETF chart has the price at $77,028.94, weekly net inflows of $1.92 billion, the largest week since October 2025, and total net assets of $96.07 billion. The cartoon in the pack is the desk's point about timing: the queue was at $78,000, not at $60,000.
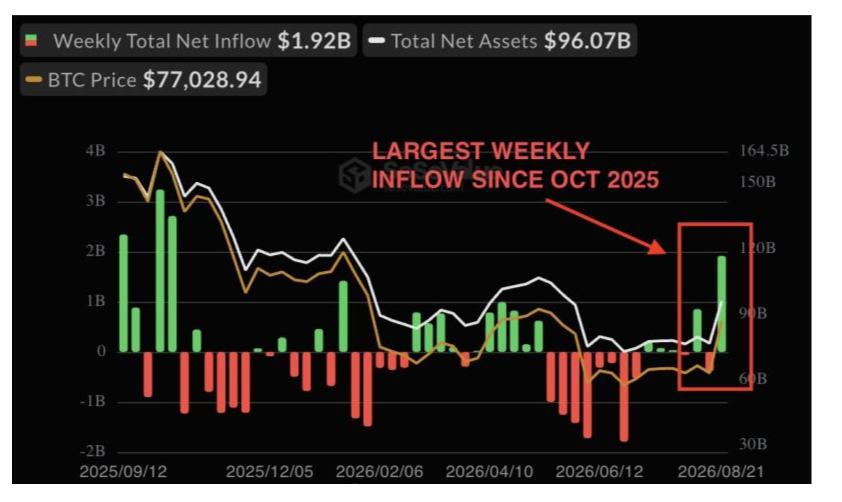
Spot bitcoin ETF flows. Weekly net inflow $1.92 billion, the largest since October 2025. Price on the chart: $77,028.94. Total net assets $96.07 billion.
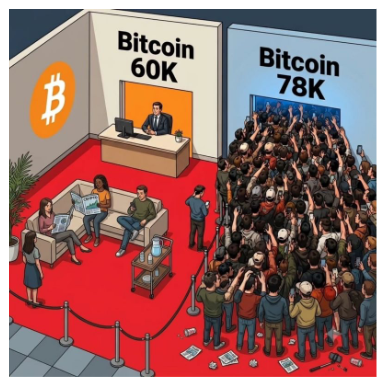
The desk's drawing of the same move: little interest near $60,000, a crowd near $78,000.
Housing, food, and the AI cost base
Housing is the soft patch under the earnings numbers. The NAHB index printed lower. Single-family starts fell 1.7% on the month, with the 30-year mortgage rate still above 6.6%. The long chart of starts shows the post-pandemic slide and how far the series still sits under the mid-2000s peak.
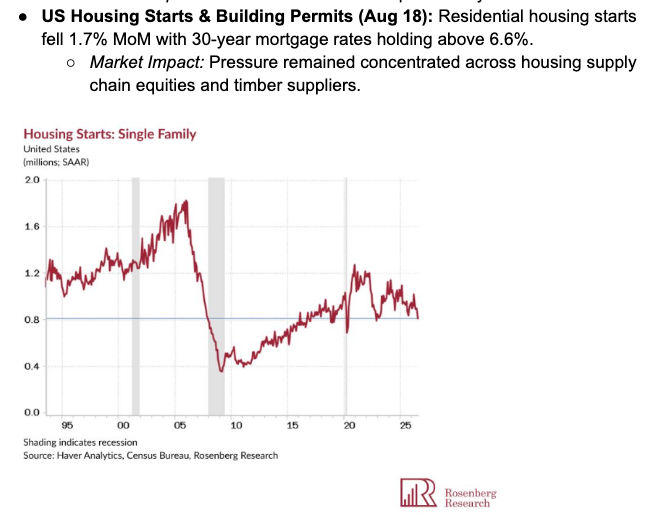
US single-family housing starts. Starts fell 1.7% on the month, with the 30-year mortgage rate still above 6.6%. Source: Census Bureau, Haver, Rosenberg Research.
The desk put two inflation charts in the same pile as housing, because both feed the next CPI argument. One is food, tied to energy costs and a tighter supply of refining by-products. The other is memory prices. Nvidia has told customers that prices are going up because of memory. Agent token use is the volume chart next to that, and the one after it is the caching those workloads are leaning on.
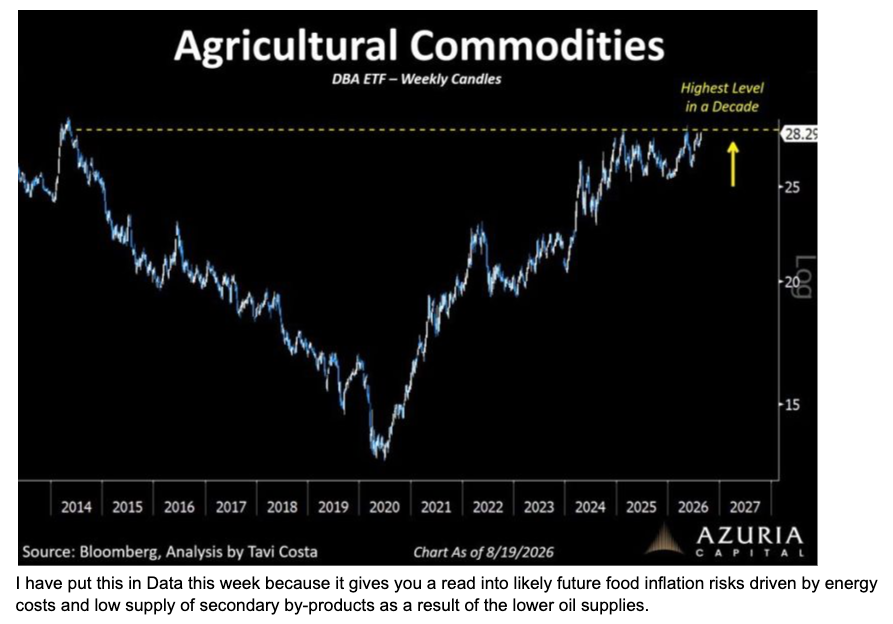
Food-price pressure the desk has tied to energy costs and a tighter supply of refining by-products.
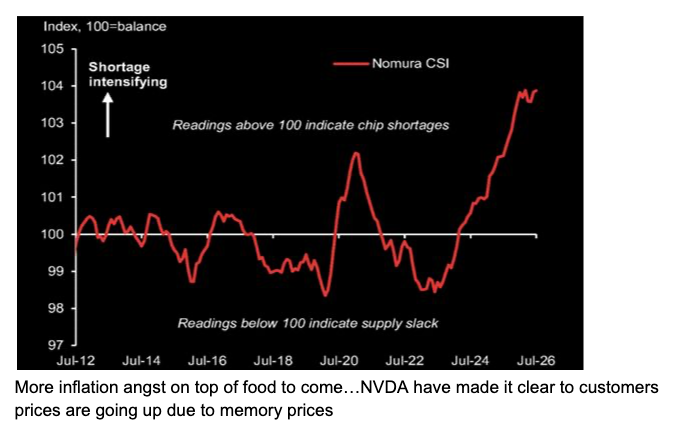
Memory-price inflation. Nvidia has told customers that chip prices are rising because of it.
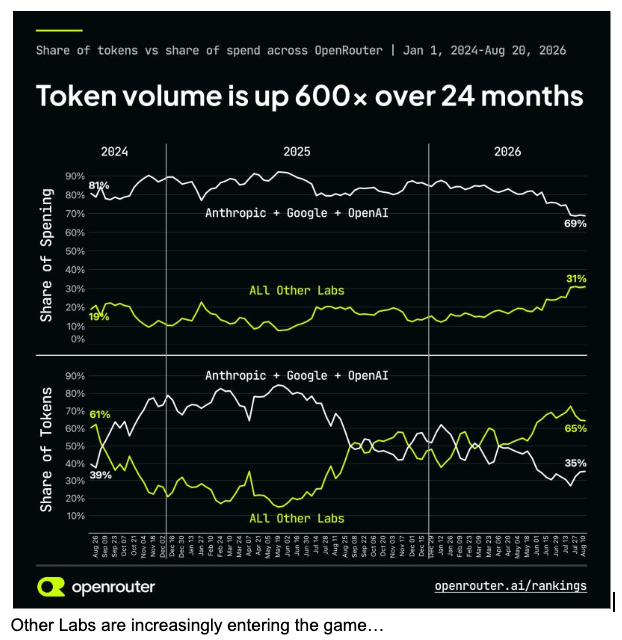
AI agent token use, on the desk's chart.
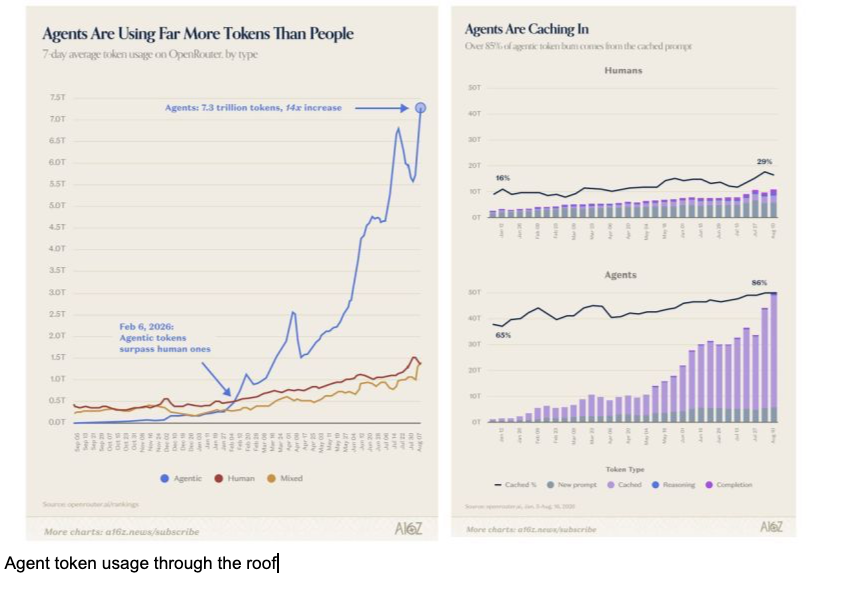
The caching layer under that token use.
Earnings, with Nvidia on Wednesday
With about 90% of the S&P 500 reported, the desk has second-quarter earnings growth at 50% year on year, 32% excluding Alphabet and Amazon, and energy at 150%. The Morgan Stanley chart splits the growth into sales and margins, and the forward bars stay high through the next few quarters. Nvidia reports Wednesday night. Bloomberg's chart, estimates as of 21 August, has adjusted earnings expected to nearly double year on year, with the next bar near $2.00. The desk notes the shares have fallen after each of the last four updates, and that the questions on credit spreads and the financing loop will come back.
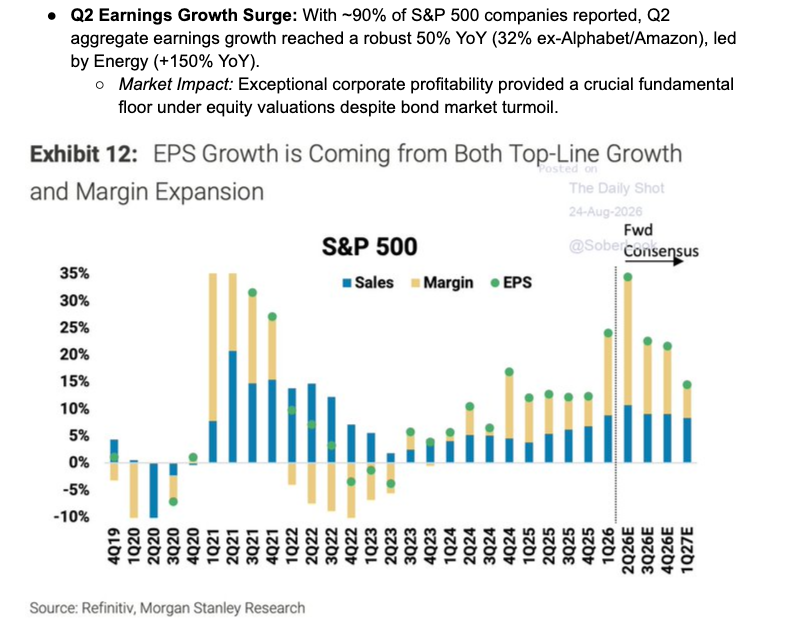
S&P 500 earnings growth split into sales and margins. Source: Refinitiv, Morgan Stanley. The desk's tally for Q2 is 50% year on year.
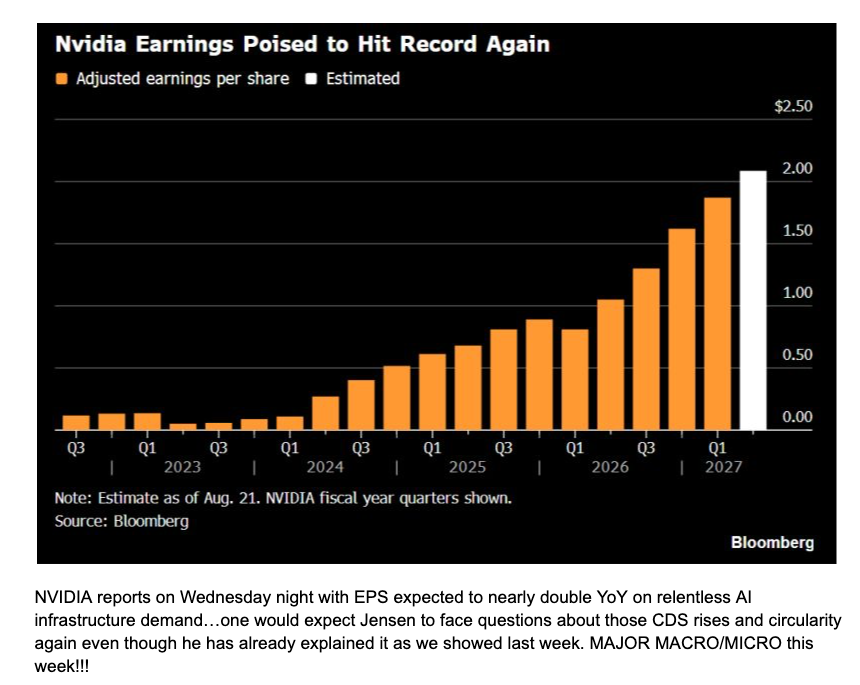
Nvidia adjusted EPS, with the next quarter estimated near $2.00. Estimates as of 21 August. Source: Bloomberg. Nvidia reports Wednesday 26 August.
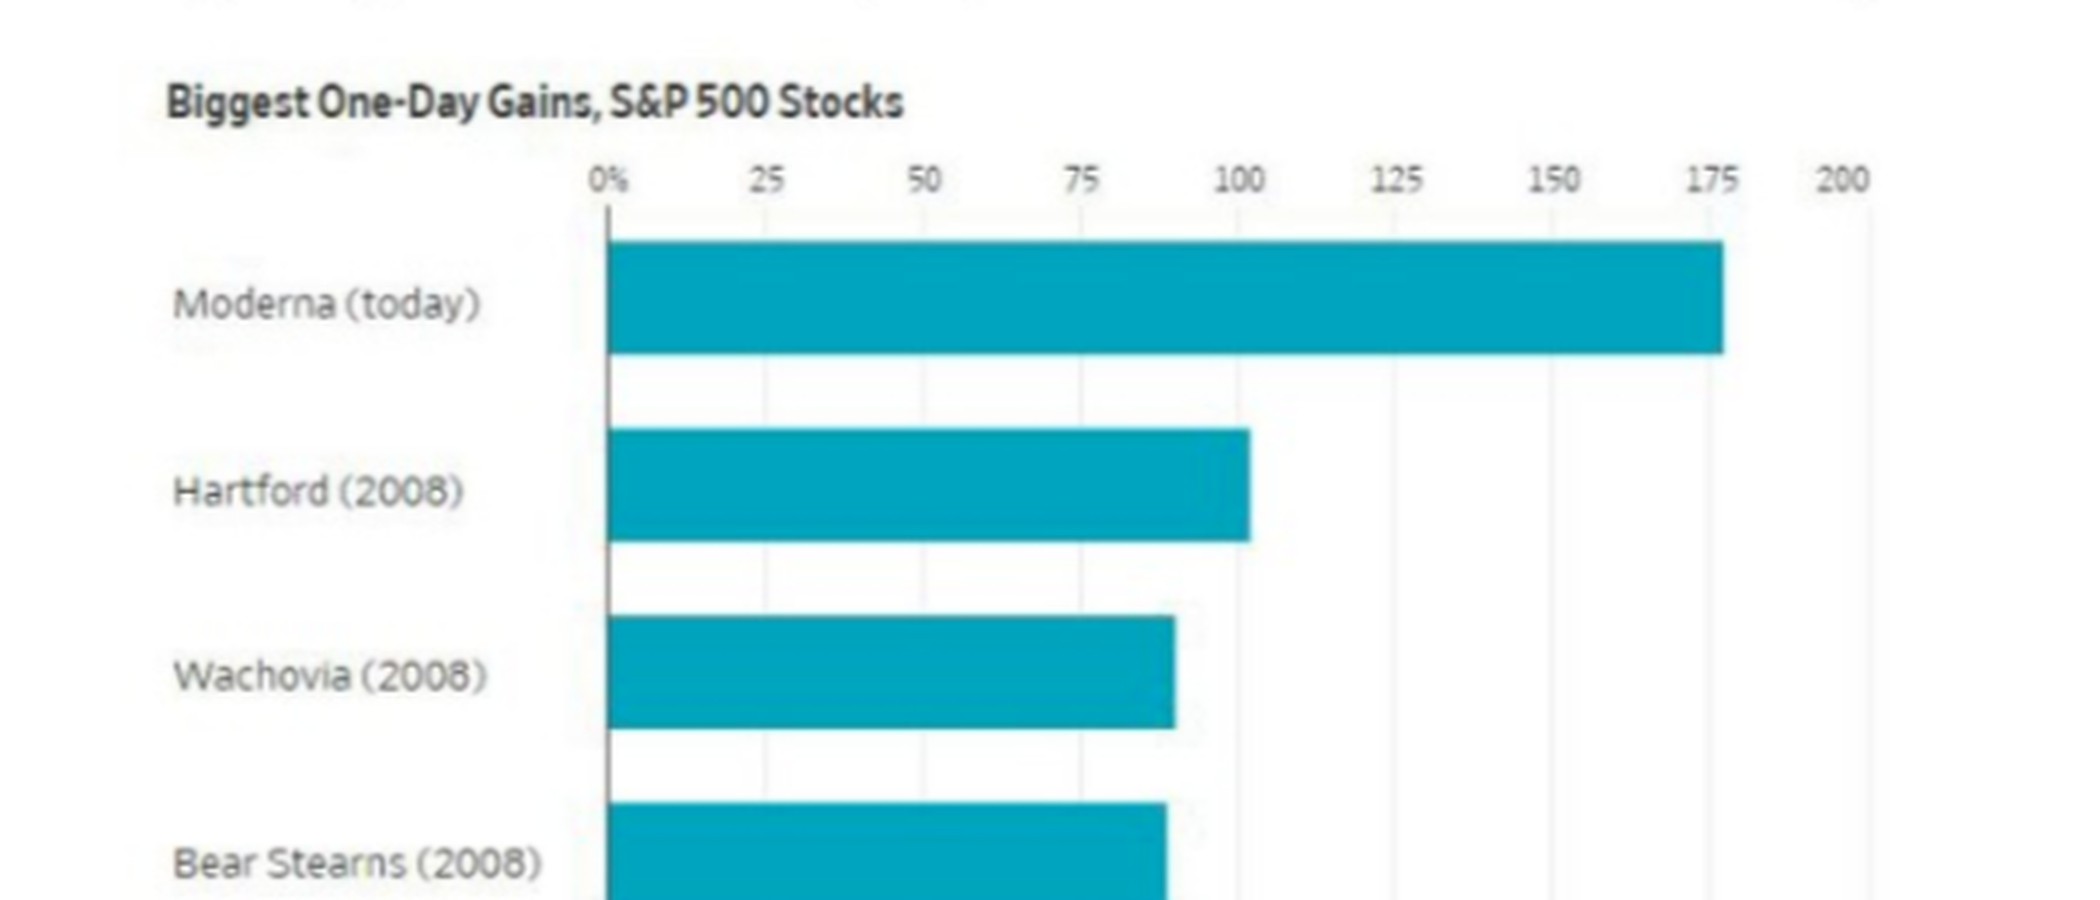
Moderna is the single-name outlier. The Barchart graphic the desk included has the stock up 177% in one session, and calls that the largest one-day gain of any S&P 500 name this century. The comparison bars are Hartford in 2008, Wachovia, Bear Stearns, Williams, and Morgan Stanley.
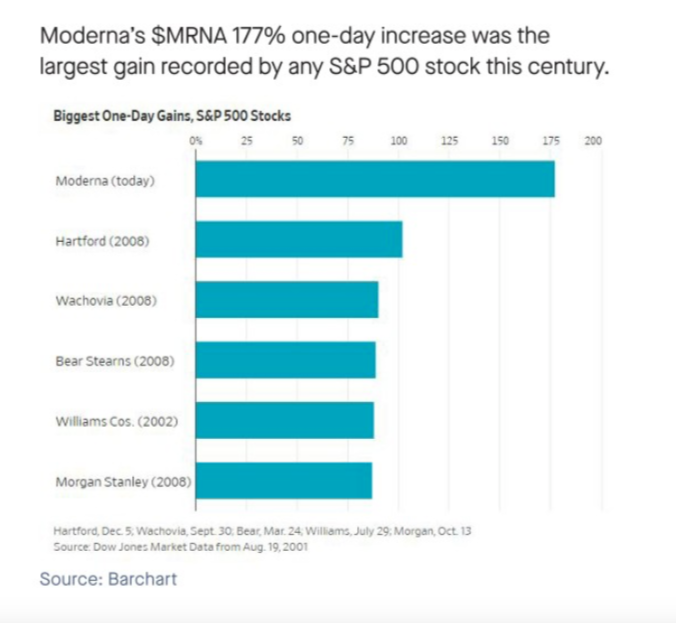
Moderna, up 177% in one session. The graphic calls it the largest one-day gain of an S&P 500 stock this century. Source: Barchart, Dow Jones.
Positioning
Hedge-fund gross leverage has had a sharp three-month peak-to-trough drop, and the desk has the latest leg of it down in the third quarter of 2026, on a chart that also marks the drops into Q4 2018, Q1 2020 and Q2 2022. Goldman has US long/short net leverage down 3 points on the week, to 48.3%, a one-year low. The flow note beside that chart has money leaving consumer discretionary, down 1.94%, and moving toward energy, up 7.33% on that tally, plus cash and gold. A second chart in the pack is the same deleveraging, drawn again.
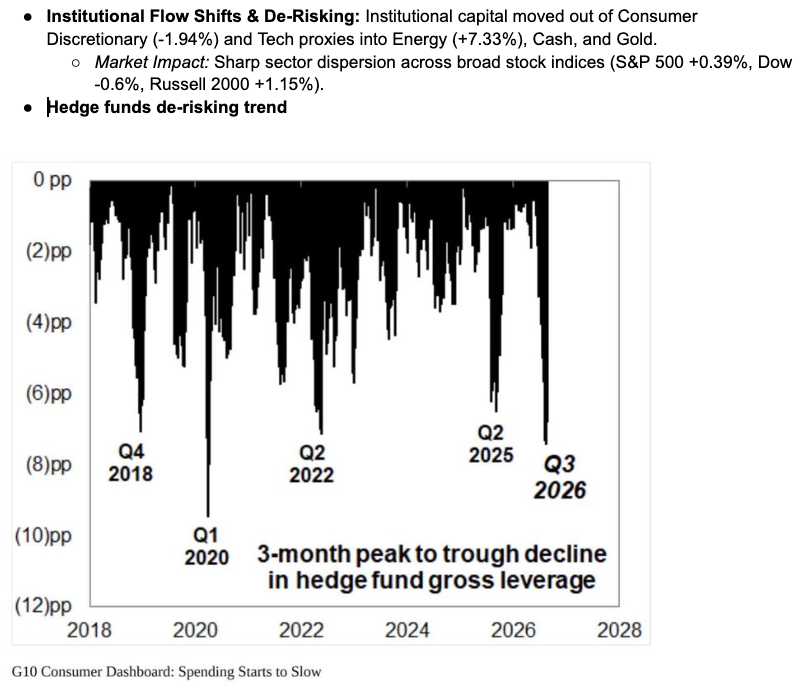
Three-month peak-to-trough decline in hedge-fund gross leverage, with the latest drop marked in Q3 2026.
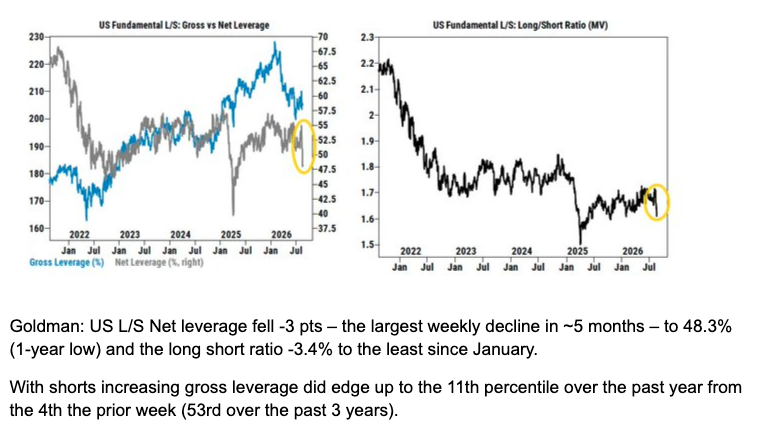
The deleveraging chart, the desk's second cut of the same story.
Deutsche Bank's chart does not match the percentiles typed in the note, and the note says so. The chart shows consolidated equity positioning at the 58th percentile since 2010, discretionary investors at the 44th, and systematic strategies at the 76th. The typed figures were 0.18 standard deviations (52nd percentile) overall, discretionary at minus 0.18 (35th), and systematic at 0.62 (77th). The picture is the chart.
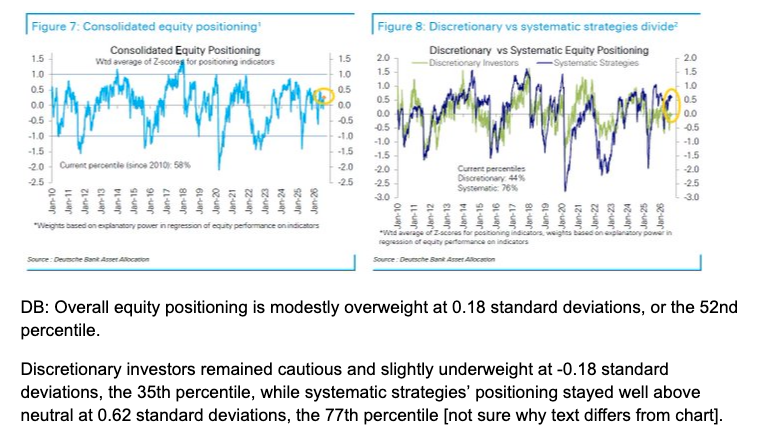
Deutsche Bank equity positioning. The chart reads 58th percentile overall, discretionary 44th, systematic 76th. The note's typed percentiles differ, and the desk flagged that.
Volatility did not confirm the bond move. The VIX sat around 15. BofA had dealer gamma at $3.2 billion as of Thursday, the 39th percentile of the past year, and still positive into the Jackson Hole expiries of 27 and 28 August, which together were about $2.8 billion of that gamma. The desk's two charts here are gamma falling off, with only a small long left, and low VIX sitting next to low gamma. SPY closed below its open for six straight days. Near all-time highs, the desk's count is higher three months later in 10 of 11 cases, median gain 5%. One session's share volume was the fourth-lowest of the year, about 9.6 billion shares against a 20-day average of 17.4 billion.
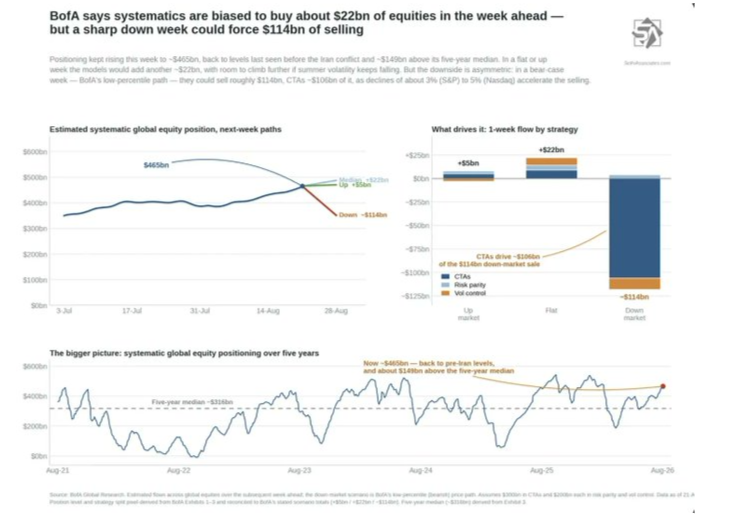
Gamma easing back, with a small long left into this week.
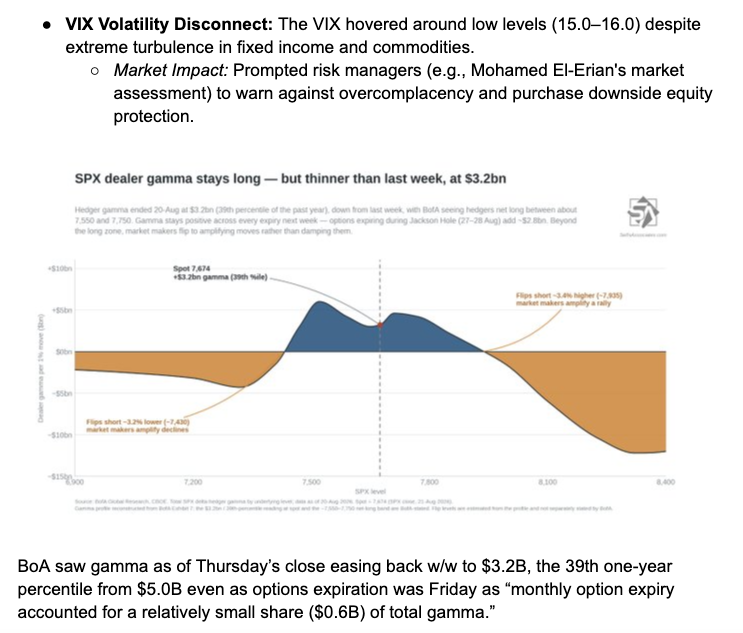
Low VIX and low gamma on the same chart.
The CNN Fear & Greed index was 53.1 on Thursday 20 August, a two-week low and the first drop in five weeks, back at neutral. On that chart the S&P is at 7,641. Three of the index's components sat above neutral and three below. Extreme greed was junk-bond demand. Fear was momentum, new highs, and the put/call ratio. The desk also has a chart it reads as JPMorgan being short, a chart of momentum under attack through 2026, and one where the AI basket has decoupled from the broader market.
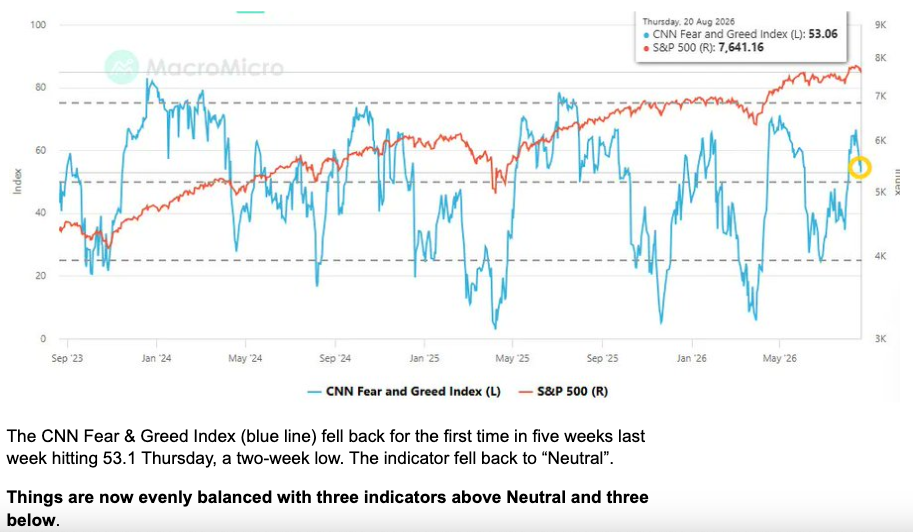
CNN Fear & Greed at 53.1 on Thursday 20 August, with the S&P at 7,641. Neutral, and split across the components.
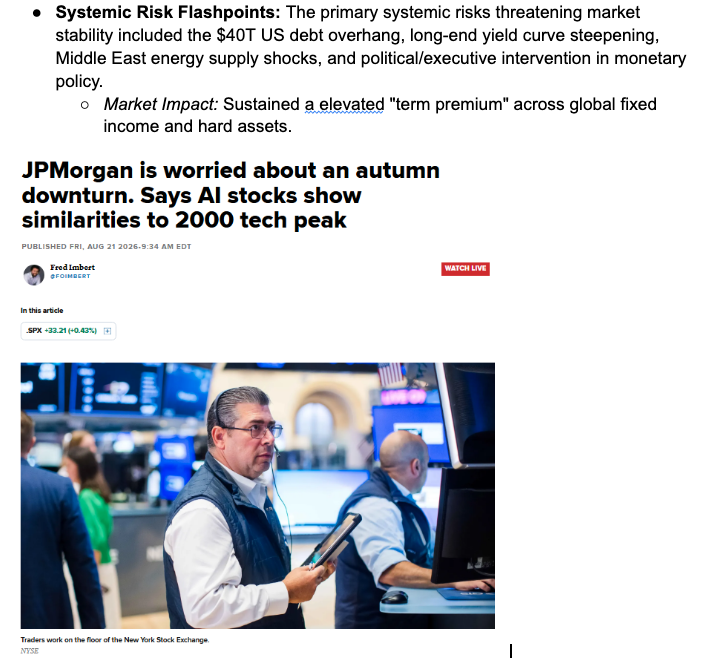
The desk's chart on JPMorgan's short.
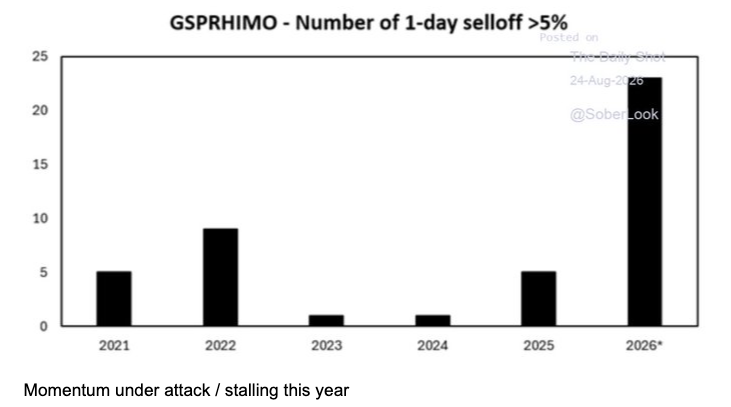
Momentum, under attack through 2026 on the desk's chart.
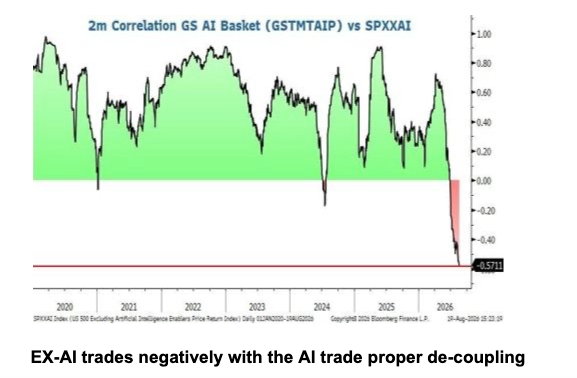
AI decoupled from the broader market.
Seasonality is the last layer. Late August is the thin-volume stretch, and the desk has a chart for poor volume running into weaker interest, then one for the lull that usually follows an earnings season. The buyback window reopening, about $1 trillion of authorisations, is the bid they set against that lull. Two more charts are filed as the process notes: one to keep going and ignore the doubters, and one on how thin the line is between the level that holds and the one that fails. The trends chart is what they want watched once that lull passes.
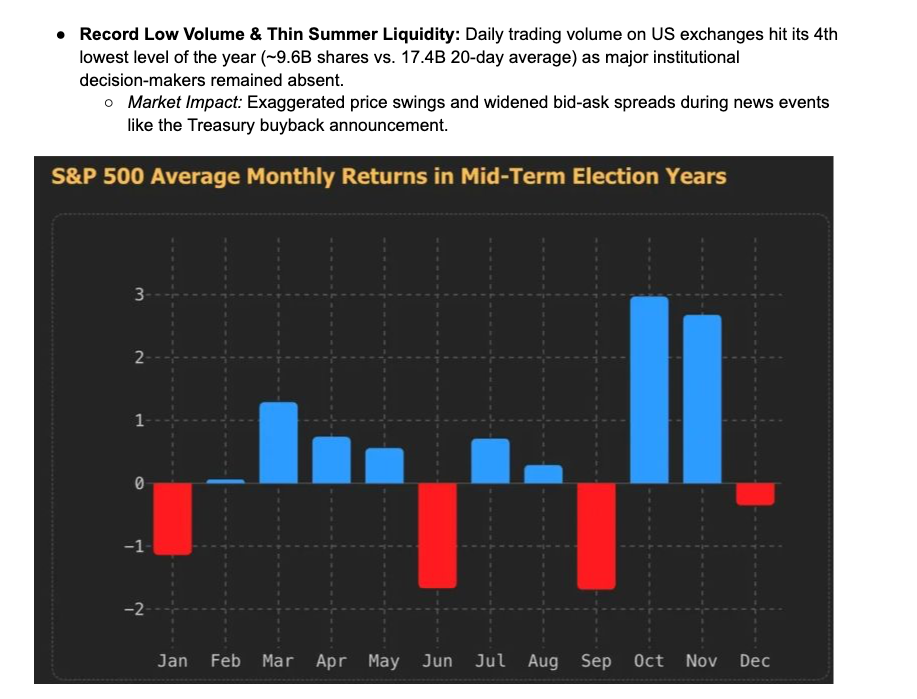
Late-August seasonality: thin volume into a stretch of weaker interest.
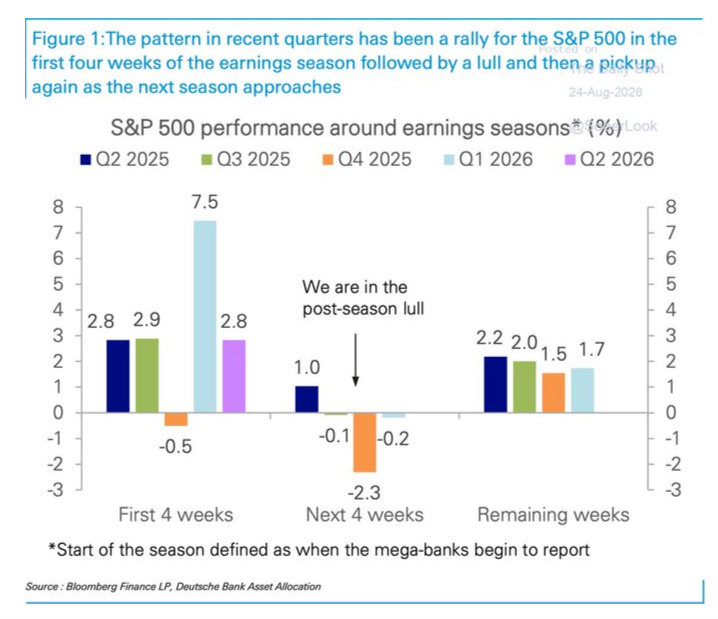
The post-earnings lull the desk has marked ahead.
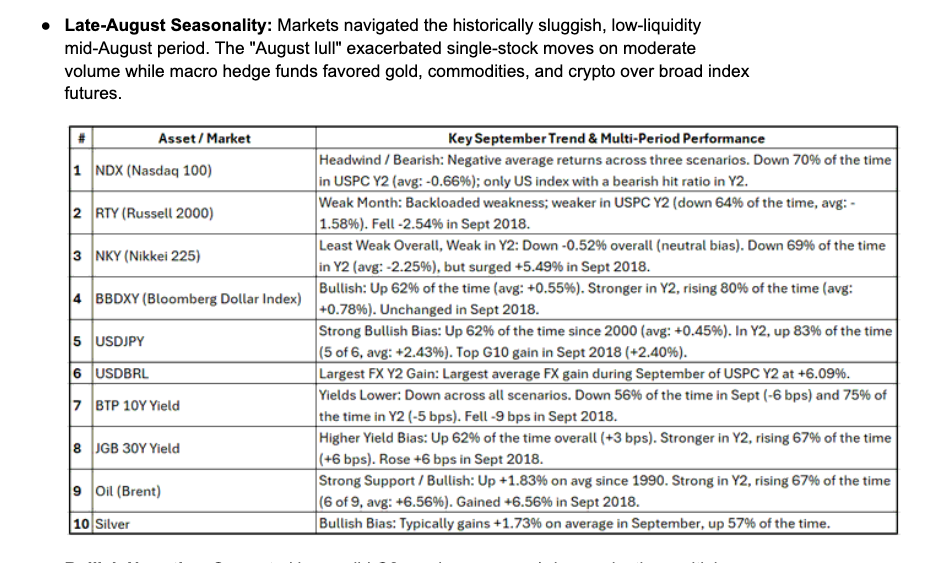
The trends the desk wants watched once that late-August lull passes.
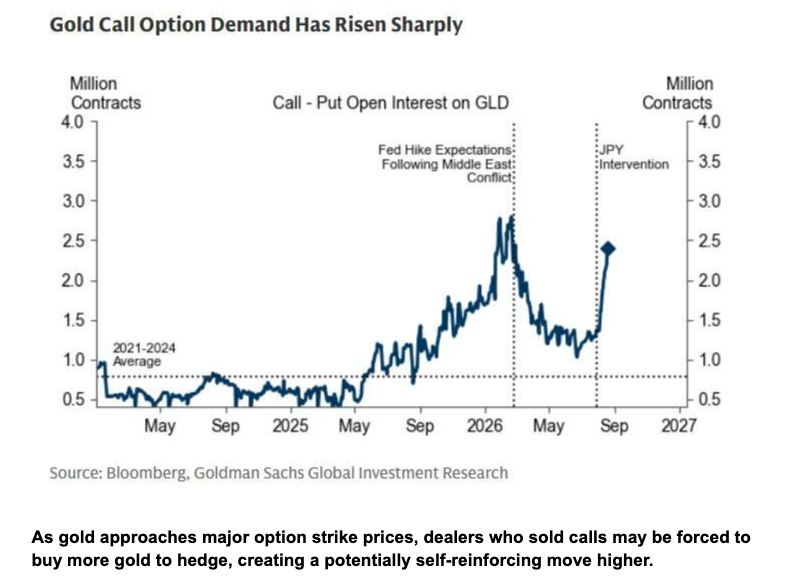
The chart the desk set aside with a note to come back to it.

The desk's longer-trend chart.

The thin line, on the desk's chart, between the level that holds and the one that fails.
The Week Ahead: Key Data and Market-Moving Signals
Nvidia on Wednesday night and Chair Warsh at Jackson Hole on Friday are the two events the desk has circled. PCE and the second look at second-quarter GDP land the same day as Nvidia. The BLS preliminary payrolls benchmark revision is at 10:00 on Friday. Bessent's new Iran measures are on Monday's card. The Bank of Korea decides on Thursday, when Jackson Hole starts.
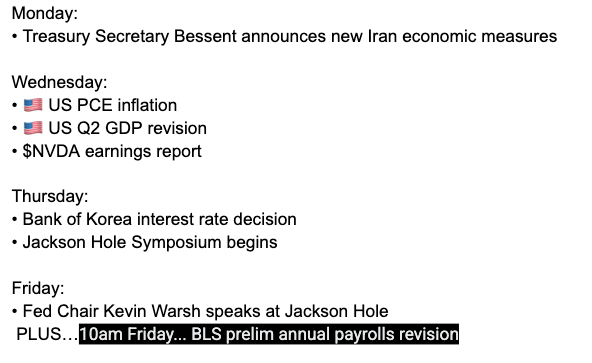
The desk's own card for the week: Bessent on Monday, PCE, GDP and Nvidia on Wednesday, the Bank of Korea and Jackson Hole on Thursday, Warsh and the payrolls revision on Friday.
Monday, August 24
- US: Treasury Secretary Bessent, Iran economic measures
- Singapore: CPI
- US: Chicago Fed National Activity Index
- Canada: Corporate Profits
- South Korea: Consumer Confidence
Tuesday, August 25
- Australia: RBA Meeting Minutes
- Japan: BoJ Core CPI
- Germany: GDP (Q2)
- Germany: Ifo Business Climate
- France: Consumer Confidence
- US: CB Consumer Confidence
- US: New Home Sales
- US: S&P/Case-Shiller House Price Index
- US: Building Permits
- US: Richmond Fed Manufacturing Index
- US: ADP Employment Change
- US: 2-Year Note Auction
- US: FOMC Member Barkin Speaks
- US: API Weekly Crude Oil Stock
Wednesday, August 26
- Australia: Monthly CPI Indicator
- UK: CBI Distributive Trades Survey
- US: PCE & Core PCE
- US: GDP (Q2, second estimate)
- US: Durable Goods Orders
- US: Personal Income & Spending
- US: Crude Oil Inventories
- US: 5-Year Note Auction
- US: FOMC Member Barkin Speaks
- Earnings: Nvidia
Thursday, August 27
- South Korea: Bank of Korea Interest Rate Decision
- Australia: Private Capital Expenditure
- China: Industrial Profits
- Germany: GfK Consumer Climate
- Eurozone: M3 Money Supply
- Eurozone: ECB Account of Monetary Policy Meeting
- US: Initial Jobless Claims
- US: Goods Trade Balance
- US: Jackson Hole Symposium begins
Friday, August 28
- Japan: Tokyo CPI
- Japan: Unemployment Rate
- UK: Nationwide House Price Index
- France: CPI & GDP
- Germany: Unemployment
- Eurozone: Business and Consumer Survey
- Canada: GDP
- US: Chicago PMI
- US: Michigan Consumer Sentiment
- US: Preliminary annual payrolls benchmark revision
- US: Fed Chair Kevin Warsh Speaks
- US: Jackson Hole Symposium
Takeaway
The 30-year met 5.3% and the buyback took the latest close back to 5.184%. Brent through $93 is what stopped that bond rally from sticking. Gold is through $4,600, with $4,400 as the level the desk is using underneath and $4,720 as the next band on the chart. The S&P is in a 7,620 to 7,780 range, with second-quarter earnings growth of 50% as the number the bond move has not erased. Wednesday is Nvidia, PCE and GDP. Friday is Warsh, and the payrolls benchmark revision at 10:00.
Rates
30-year spiked to about 5.30%, buybacks from $2 billion to $4 billion-plus an operation from 9 September, latest close 5.184%. 10-year at 4.66% on the Brent overlay. Debt at $40 trillion. The Fed holds 53% of the 10-to-15-year bucket.
Gold, oil, dollar
Gold through $4,600, chart close $4,586, Monday push that touched $4,700. Brent high $93.97, close $90.53. Dollar index 98.95, under the 200-day at 99.17. Bitcoin ETF weekly inflow $1.92 billion, price on that chart $77,029.
Equities
S&P 500 about minus 1.6% on the week, near 7,675, range 7,620 to 7,780. GDX up 11.9%. Energy up 7.33%. Moderna up 177% in a session. Nvidia Wednesday night.
Charts and figures are from the 24 August 2026 weekly pack. This is a recap of that tape. It is not a personal recommendation, and nothing in it is guaranteed.