A Rotation Shock, Not a Risk-Off Rout, as Capital Flees Crowded AI and Hunts for Current Cash Flow
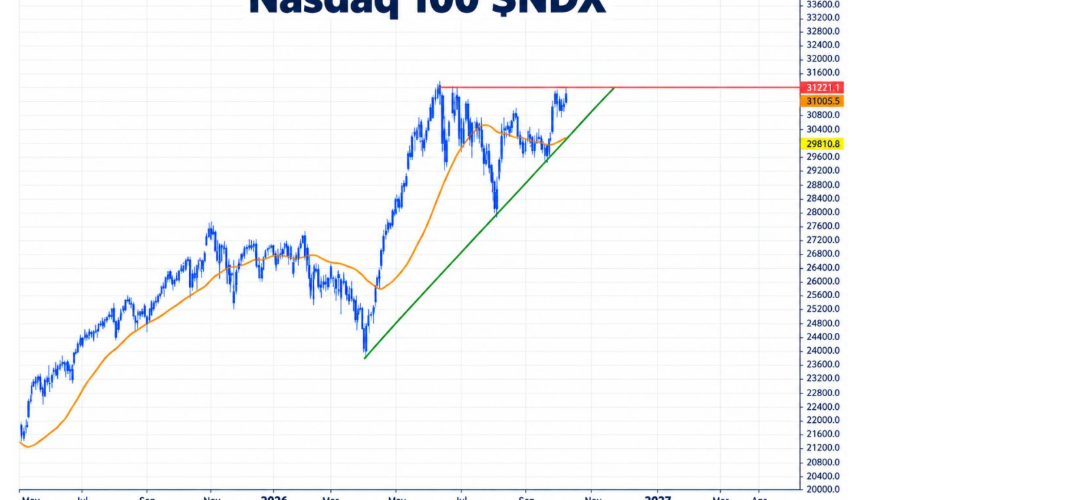
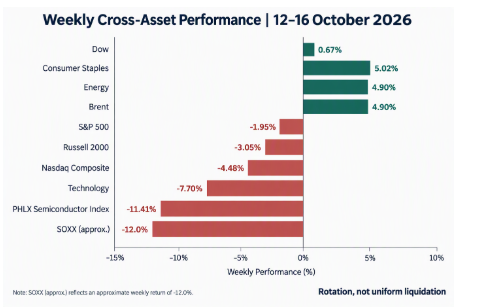
Last week was not the clean liquidation the Nasdaq headline implied. From Monday 12 October to Friday 16 October, the S&P 500 fell 1.95% to 7,659.44, and the Nasdaq Composite dropped 4.48% to 26,140.03, yet the Dow actually rose 0.67% to 52,002.41. That split is the whole story: capital left the most crowded growth trades, but it did not leave equities altogether.
The damage was concentrated and violent. The PHLX Semiconductor Index fell 11.41%, while the equal-weighted market held up far better than the headline tape suggested. September CPI ran hot, yields spiked, and then the equity sell-off itself pulled longer yields lower as money ran for Treasuries. Participation narrowed, and fear rose, but the defensives held the line. This was a market choosing sides, not heading for the exits.
Market Overview: A Concentration Unwind With the Defensives Doing the Catching
The cleanest read on the week is what did not break. Technology fell 7.70%, but consumer staples gained 5.02%, energy added 4.86%, healthcare rose about 3.45%, utilities 1.93% and financials 1.44%. Investors were rotating out of expensive growth stories and into banks, energy producers and defensive businesses with visible current earnings.
The equal-weight S&P gained around 0.5% while the cap-weighted index fell nearly 2%, lifting the RSP/SPY ratio about 2.5%, its best weekly rotation signal in years.
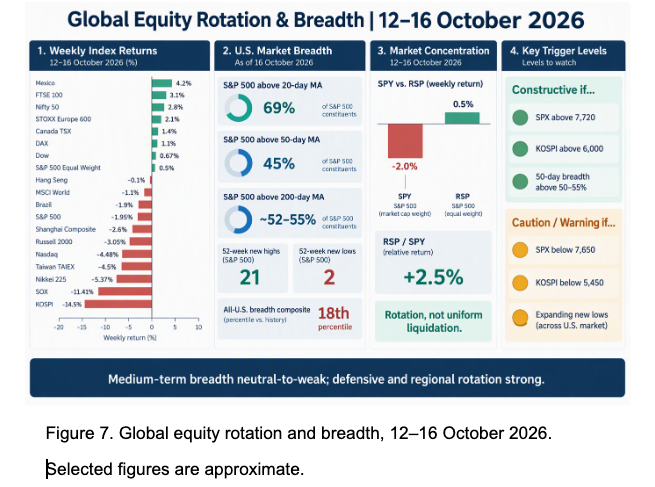
The flow picture confirms positioning, not panic. Money moved into different parts of the market rather than off the table, with Europe and the UK the bright spot: the STOXX Europe 600 rose about 2.1%, the FTSE 100 around 3.1%.
The real fracture is concentration. Technology now represents about 38% of the S&P 500, while the five strongest smaller sectors together make up only around 14%. The arithmetic is unforgiving: another 5% fall in technology subtracts roughly 1.9 percentage points from the index before any second-order effects. The defensives can cushion, but they cannot carry.
Macro & Policy Watch: An Energy Inflation Shock Meets a Hawkish-but-Patient Fed
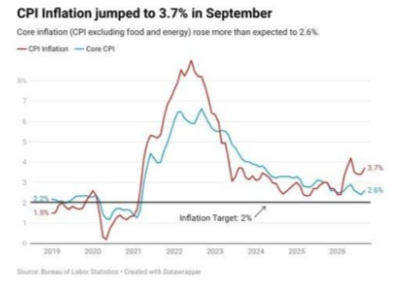
Inflation delivered the week's macro jolt, but composition mattered more than the headline. September CPI rose 0.6% on the month and 3.7% year on year, yet gasoline alone rose 9.1% and accounted for more than half the monthly increase. Core CPI was far tamer at 0.3% monthly and 2.6% annually. The report was hawkish because an energy shock can spread, not because domestic disinflation had broken.
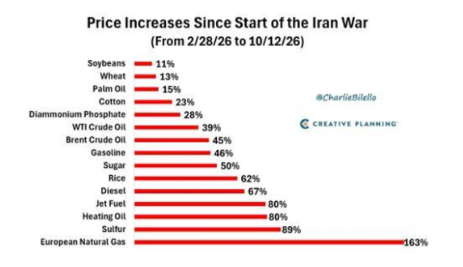
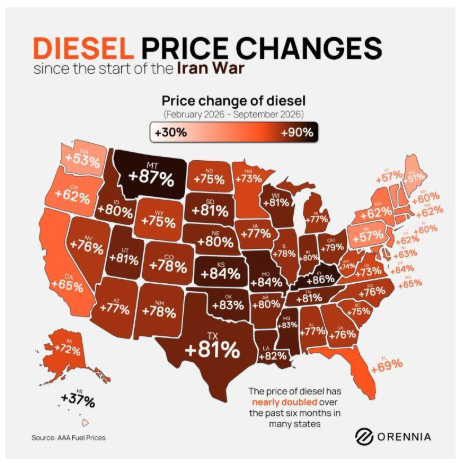
The producer-price data was the more serious warning. Final-demand PPI rose 1.3% in September, the largest monthly increase since March 2022, and 6.3% year on year. Gasoline jumped 20.3%, diesel 21.0% and jet fuel 15.4%. Even excluding food, energy and trade services, PPI still rose 0.5%, so the pressure was broader than fuel alone. This becomes a pricing-power test: businesses with strong brands or fuel surcharges are far better placed than low-margin manufacturers, retailers and transport users.
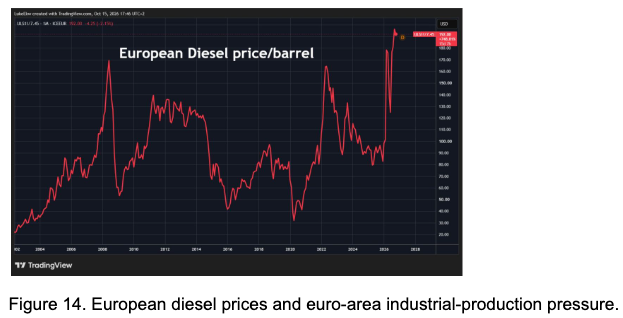
The real stress sat in middle distillates, not crude. US distillate stocks were about 12% below their five-year seasonal average, and European diesel prices approaching $200 a barrel coincided with another decline in euro-area industrial production. That is the transmission mechanism: higher transport and factory costs test pricing power, compress margins, then delay investment. Germany is especially exposed, with industrial production already well below its 2021 level.
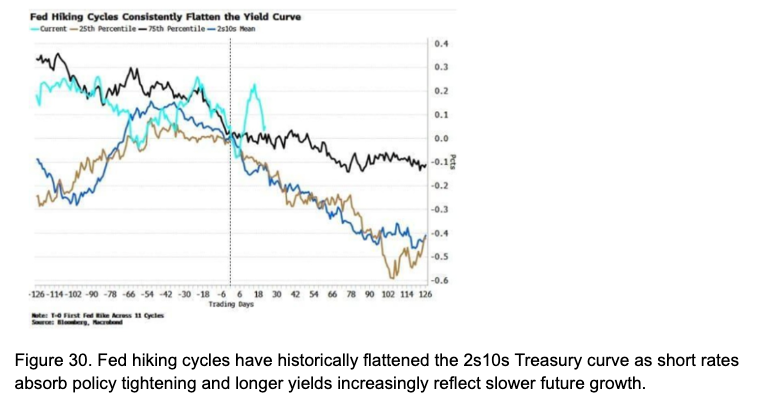
Central banks stayed deliberately non-committal. Chair Kevin Warsh declined to pre-announce the 27 to 28 October decision, stressing that inflation remained too high and policy had to preserve credibility. Markets ended the week pricing only a modest chance of an October hike but a much higher probability of action by December, with October pricing near 29%. The Fed entered its blackout after Friday.
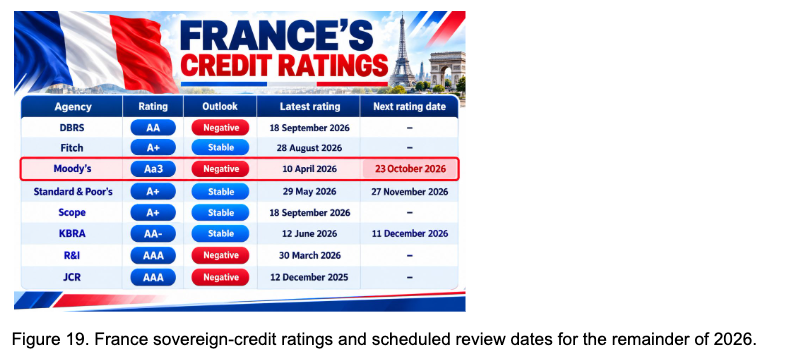
Europe's geopolitical risk increasingly overlapped with fiscal risk, and France remained the clearest fault line. The 10-year OAT yielded roughly 4.8 to 4.9%, leaving the OAT-Bund premium around 140 basis points and, unusually, French borrowing costs above Italy's. With Moody's scheduled to review France, the sovereign question has a live near-term catalyst.
Technical & Sentiment Breakdown: Supportive, but Increasingly Fragile
The structure is intact, but the internals are doing the arguing. On Friday, 248 S&P 500 stocks advanced and 252 declined, with 69% above their 20-day average but only 45% above the 50-day. Across the broader US universe, only about 40% were above the 50-day, and a composite of 14 breadth measures ranked all US stocks in just the 18th percentile of the past five years. The message is high dispersion: enough stocks holding up to prevent capitulation, but too thin to validate a fresh advance.
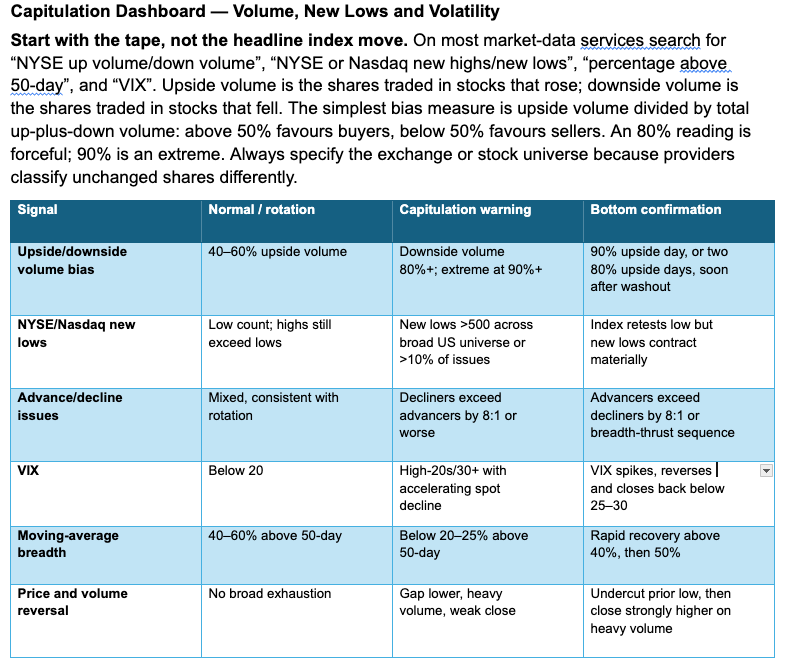
Capitulation was real, but local. The SOX fell for eight consecutive sessions and the eight listed neoclouds lost roughly 22% on average, with CoreWeave down 15.5% in a single day. The broader market was nowhere near it: the VIX closed at 19.99 rather than above 30, Friday's advance-decline split was almost even, and equal weight rose on the week.
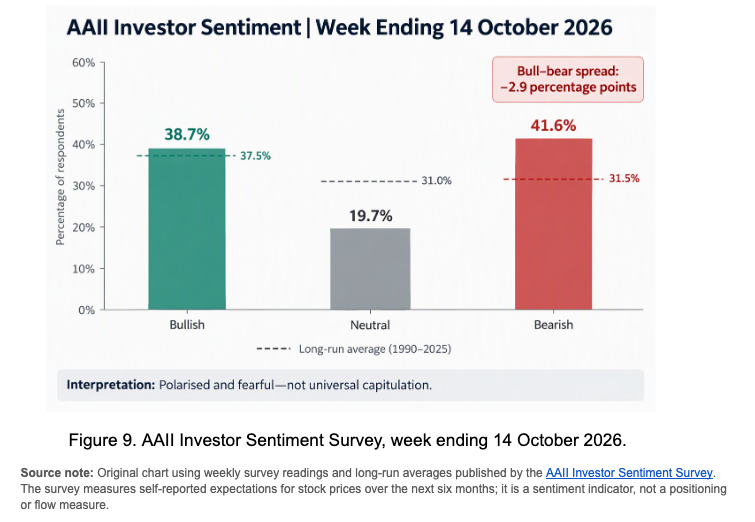
Sentiment moved from complacency to fear, but not to a washed-out market. The Fear & Greed reading ended near 18, in Extreme Fear, while the AAII survey showed 38.7% bulls against 41.6% bears. Neutral responses were unusually low at 19.7%, the signature of a polarised market where investors have picked sides rather than abandoned equities.
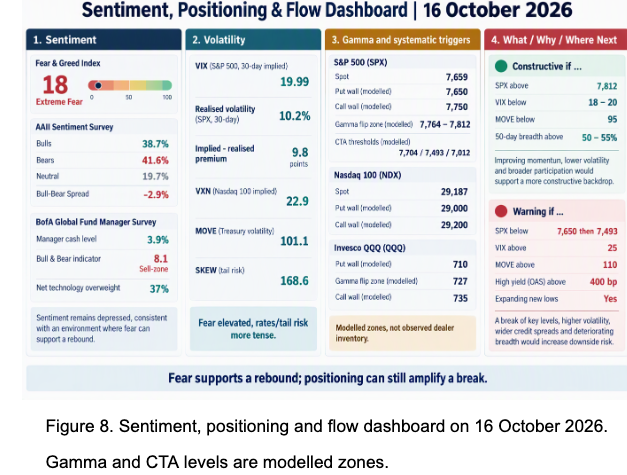
The consensus-risk flag is the gap between retail fear and professional crowding. The October Bank of America survey reported average cash at only 3.9% of assets, a Bull & Bear Indicator of 8.1, just inside its contrarian sell zone, and the largest technology overweight since August 2020 at net 37%. Public opinion looked fearful while institutional portfolios still carried concentrated growth exposure with little cash protection.
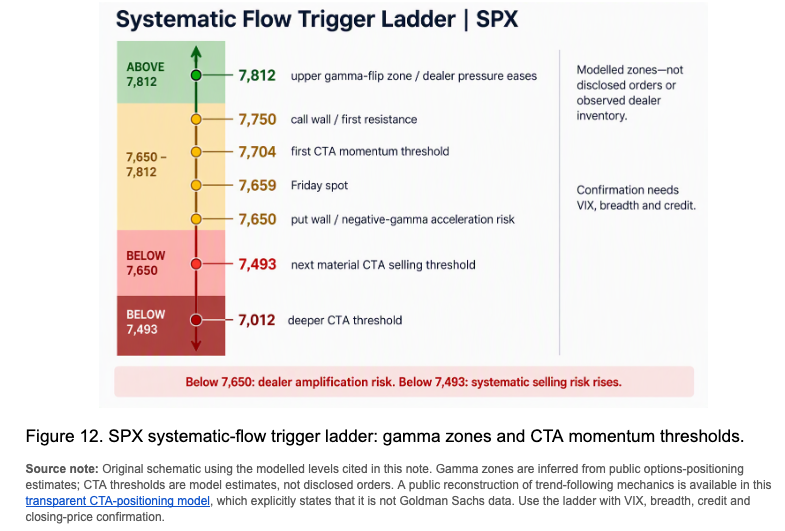
Volatility sent the more uncomfortable signal through rates, not stocks. MOVE remained elevated near 101.1 even after easing late in the week, confirming bonds were pricing more instability than equities. The dealer-gamma picture left SPX sitting on its acceleration point, with spot at 7,659, the put wall at 7,650 to 7,660 and the gamma flip around 7,764 to 7,812, net gamma negative. Below the flip, dealers amplify direction.
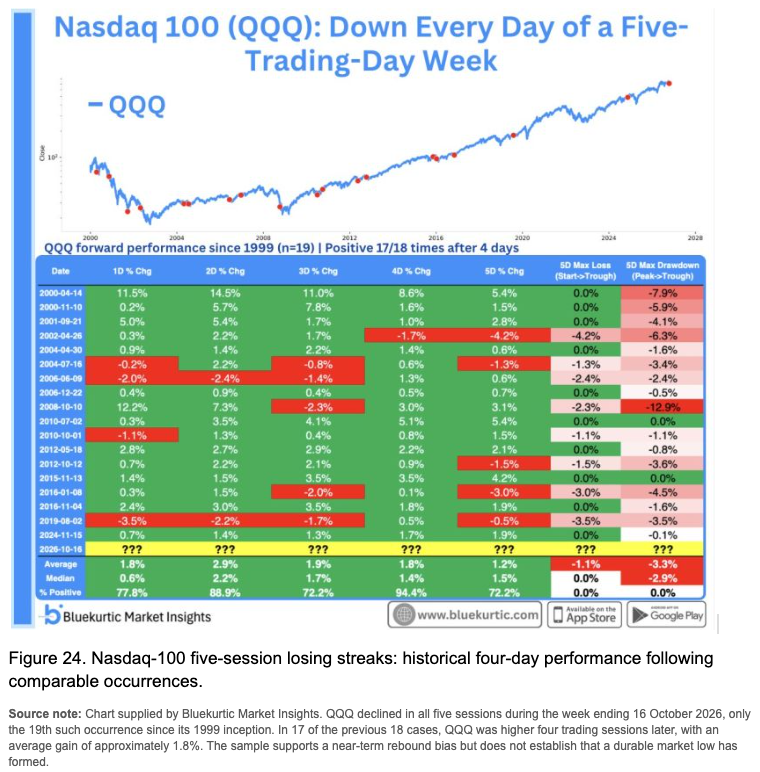
One constructive tell: QQQ fell in all five sessions, only the 19th such occurrence since 1999, and in 17 of the previous 18 cases it was higher four sessions later. That answers the next four days, not whether the correction is complete.
Last Week's Recap: Resilient Breadth, Defensive Leadership and an Energy-Led Inflation Edge
A rotation shock dressed up as a rout, where the Nasdaq's damage masked a profitable week for defensives, banks and energy, and bonds quietly reclaimed their haven status.
Key Highlights
Macro: The genuinely market-moving releases were US CPI and PPI, and the deeper read was less alarming than the headline CPI and more troubling than retail sales. Retail sales rose 0.8%, but petrol-station receipts jumped 6.4%, and the GDP-linked control group rose just 0.1%. Globally, euro-area inflation was confirmed at 3.8%, while Australia shed 39,300 jobs and cut the odds of another RBA rise.
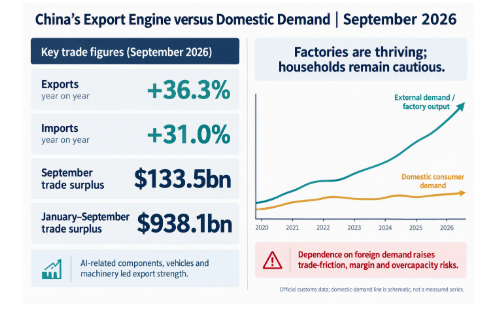
China: China showed upstream inflation without strong household demand. September exports rose 36.3% year on year and imports 31.0%, producing a $133.5 billion monthly surplus. AI components, vehicles and machinery powered factory expansion even as property activity and confidence stayed weak. Until households regain the confidence to spend, stronger exports can cushion domestic weakness but cannot replace it.
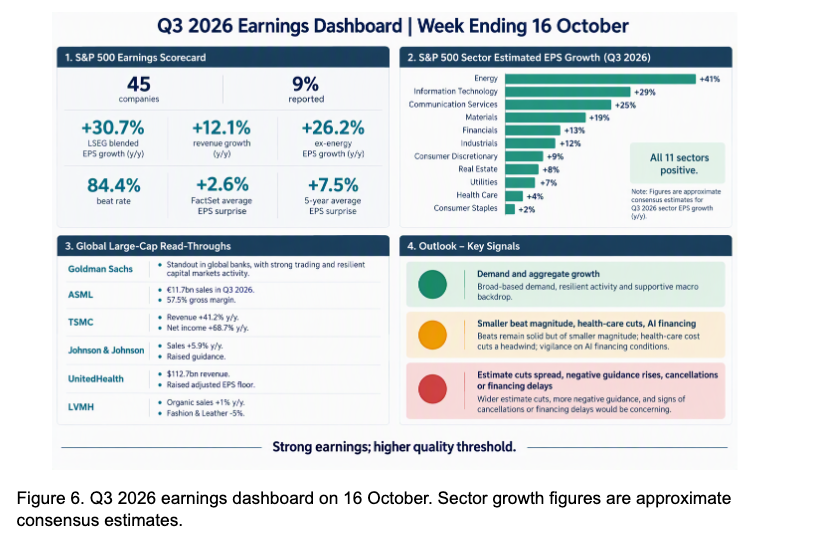
Earnings: Q3 opened with exceptional aggregate growth but a less convincing surprise profile. With only 45 S&P 500 companies reported, LSEG estimated blended earnings growth of 30.7%, with all 11 sectors expected to post positive growth. The caution: 84% beat profit forecasts, but the average beat was only 2.6%, far below the five-year average of 7.5%. ASML and TSMC posted record results, yet even those AI-demand signals could not stop the semiconductor sell-off.
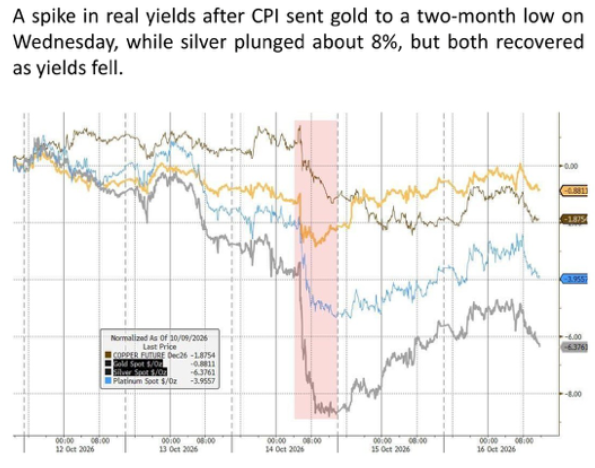
Commodities: The complex refused to send one signal. Gold proved resilient but not immune to real yields, finishing near $4,165 to $4,188 after recovering most of a sharp CPI-driven drop. Silver fell harder, down about 6.3 to 6.7% as its industrial role dominated, lifting the gold/silver ratio from roughly 69 to 73. Copper held near record territory as physical tightness offset macro pressure.
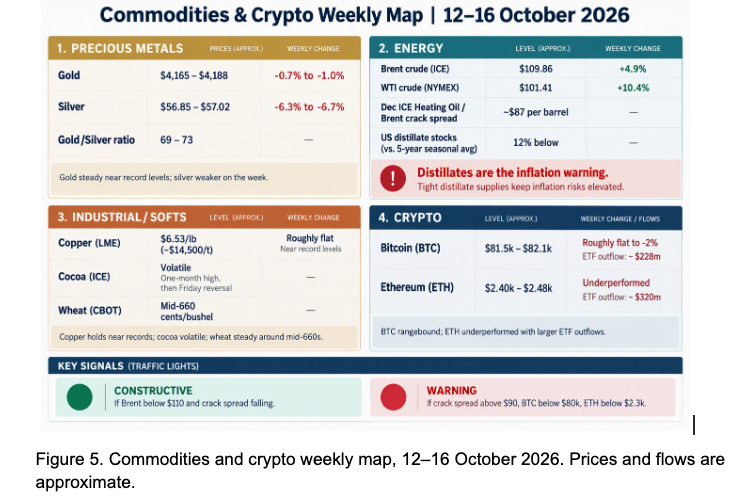
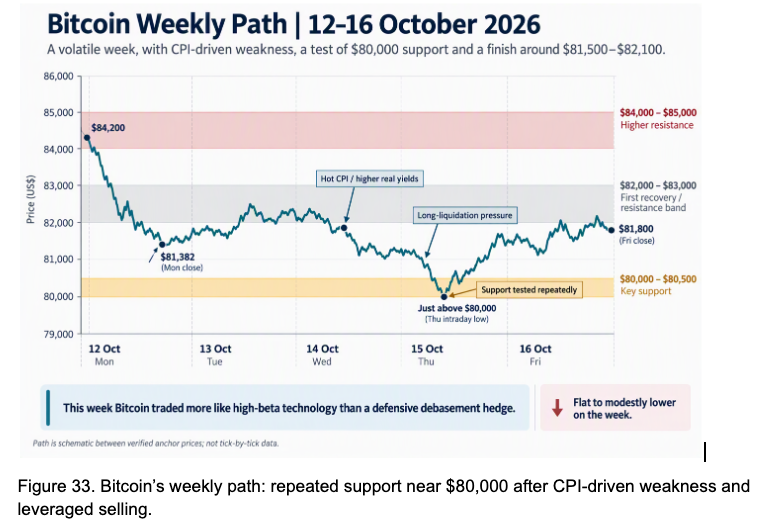
Crypto: Digital assets behaved more like long-duration technology than digital gold. Bitcoin finished near 81,500 to 82,100 after briefly dipping toward $80,000, holding up better than Ethereum and the Nasdaq but failing to act as a safe haven. The flow signal was clearer than the price: US spot Bitcoin ETFs lost about $228 million, while Ethereum ETFs shed roughly $320 million.
Oil: Brent, not WTI, remained the global geopolitical benchmark, finishing near $109.86 a barrel, up about 4.9% on the week, while WTI rose roughly 10.4% to $101.41. The more important read-through came from refined products: with distillate inventories about 12% below their five-year average and the diesel crack still around $100 a barrel, the bottleneck was refinery capacity and logistics, not missing crude.
The Week Ahead: Key Data and Market-Moving Signals
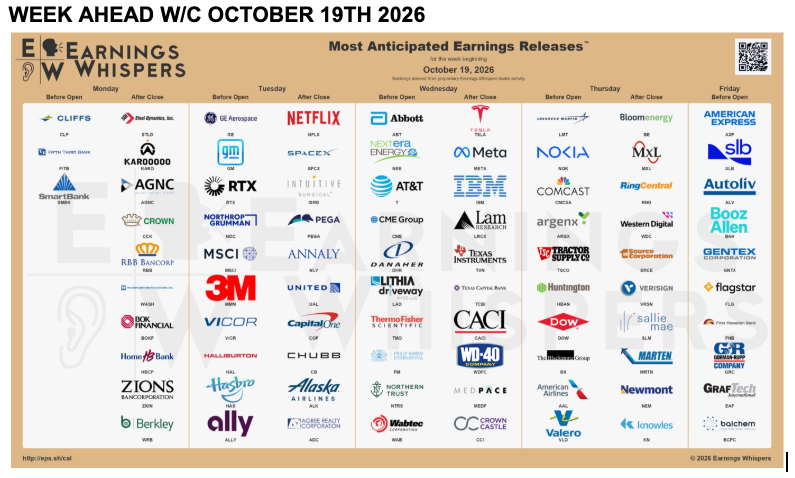
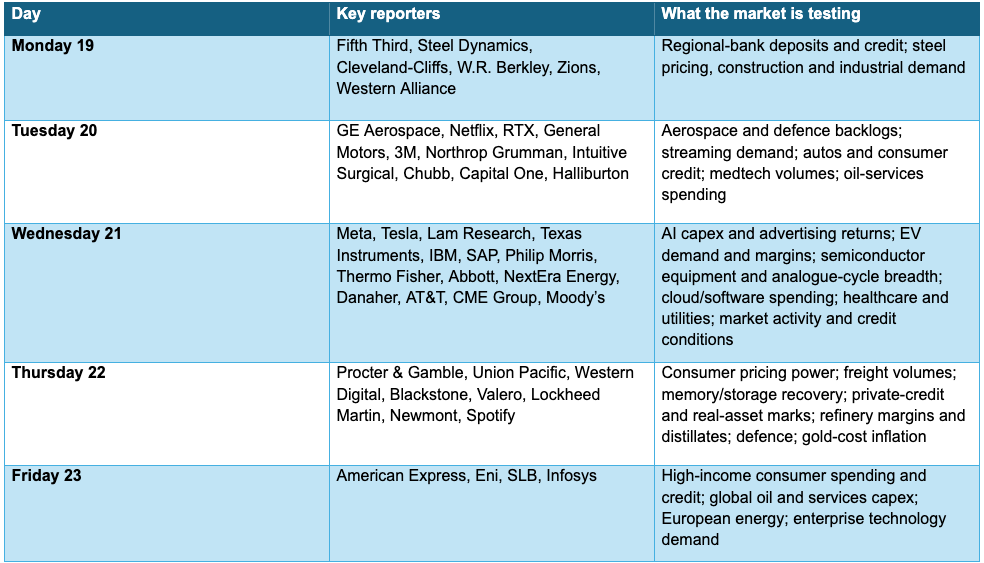
A lighter US data week shifts the market's centre of gravity toward China, global flash PMIs, inflation outside the US and a decisive run of corporate earnings. With the Fed in blackout ahead of the 27 to 28 October FOMC, local central-bank commentary, France's Moody's review and two US duration auctions carry the macro weight.
Monday, October 19
- China: GDP (Q3), Industrial Production, Retail Sales, Fixed-Asset Investment, Unemployment Rate (Sep)
- China: House Prices (Sep); NBS Press Conference
- Canada: CPI, Core CPI, Trimmed & Median CPI (Sep)
- UK: Rightmove House Price Index (Oct)
- Eurozone: ECB's Lane & Elderson Speak
- Germany: Buba Monthly Report
- US: NAHB Housing Market Index (Oct)
- US: 3-Month & 6-Month Bill Auctions
- France: 3-, 6- & 12-Month BTF Auctions
- Canada: BoC Business Outlook Survey
Tuesday, October 20
- India: Dussehra (Holiday)
- China: Loan Prime Rate 5Y & PBoC Loan Prime Rate (Oct)
- UK: Claimant Count, Unemployment Rate, Average Earnings (Aug/Sep)
- Germany: PPI (Sep); ZEW Economic Sentiment (Oct)
- Eurozone: Current Account (Aug); ZEW Economic Sentiment (Oct)
- US: ADP Employment Change Weekly
- US: Housing Starts & Building Permits (Sep)
- US: Pending Home Sales (Sep); API Weekly Crude Oil Stock
- Korea: PPI (Sep)
- UK: 10-Year Treasury Gilt Auction
Wednesday, October 21
- Japan: Trade Balance, Exports & Imports (Sep)
- UK: CPI & Core CPI (Sep); PPI Input & Output (Sep)
- UK: Public Sector Net Cash Requirement (Sep)
- South Africa: CPI & Core CPI (Sep)
- US: MBA Mortgage Applications & 30-Year Mortgage Rate
- India: RBI MPC Meeting Minutes
- US: Crude Oil, Gasoline, Heating Oil & Distillate Inventories
- Russia: PPI (Sep)
- New Zealand: CPI (Q3)
- US: 20-Year Bond Auction
- Eurozone: ECB President Lagarde & Lane Speak
- Germany: Buba President Nagel Speaks
- UK: BoE Gov Bailey Speaks
Thursday, October 22
- Japan: Foreign Bonds & Stocks Flows
- Korea: Interest Rate Decision (Oct)
- UK, Italy, Germany, France: Car Registrations (Sep)
- France: Business Survey (Oct)
- Hong Kong: CPI & Unemployment Rate (Sep)
- UK: CBI Industrial Trends Orders (Oct)
- US: Initial & Continuing Jobless Claims
- Canada: RMPI & IPPI (Sep)
- US: Leading Index (Sep)
- Eurozone: Consumer Confidence (Oct)
- US: Natural Gas Storage; KC Fed Indices (Oct)
- Australia: S&P Global Flash PMIs (Oct)
- US: 4-Week & 8-Week Bill Auctions
- Switzerland: SNB Monetary Policy Assessment
- UK: BoE Gov Bailey Speaks
Friday, October 23
- UK: GfK Consumer Confidence (Oct)
- Japan: National CPI & Core CPI (Sep); Flash PMIs (Oct)
- Singapore: CPI & Core CPI (Sep)
- India: HSBC Flash PMIs (Oct)
- UK: Retail Sales (Sep); S&P Global Flash PMIs (Oct)
- France, Germany, Eurozone: HCOB Flash PMIs (Oct)
- Russia: Interest Rate Decision (Oct)
- Brazil: Mid-Month CPI (Oct)
- Canada: Retail Sales & Core Retail Sales (Aug)
- US: S&P Global Flash PMIs (Oct)
- US: Michigan Consumer Sentiment & Inflation Expectations (Oct)
- US: Baker Hughes Rig Count; CFTC Net Positions
- France: Moody's Sovereign Rating Review (Aa3, negative outlook)
Alpha Takeaway: The Rotation Can Continue, but the Buffers Have to Hold
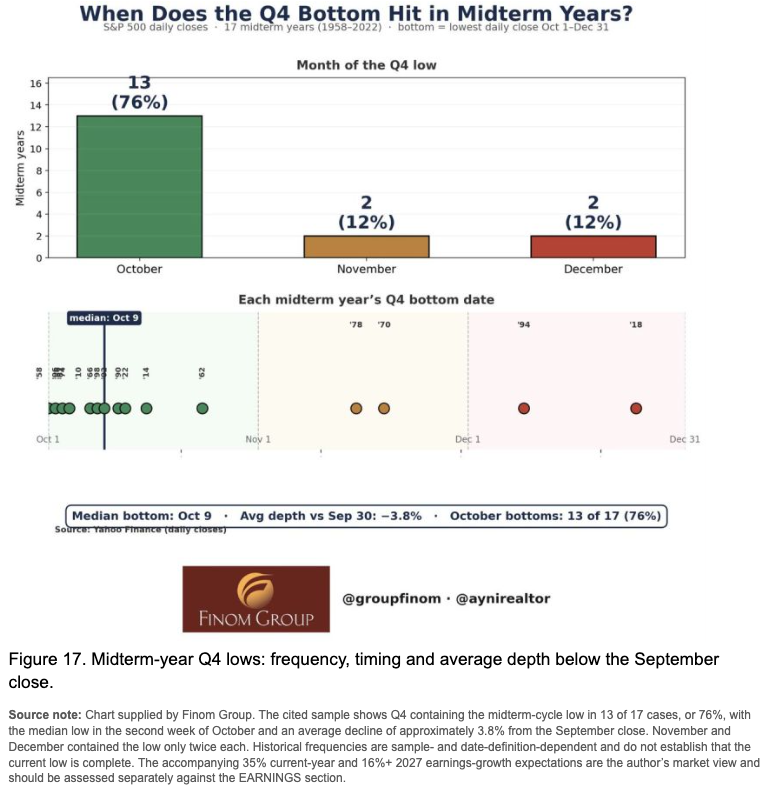
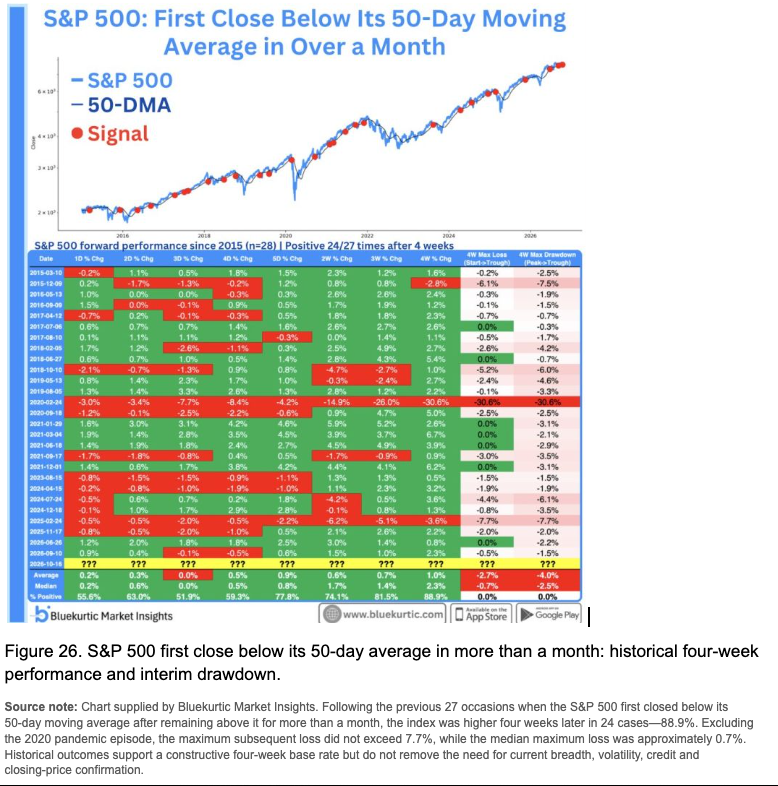
Fear is elevated enough, seasonality supportive enough and Monday's response firm enough to favour an attempted rebound, but this is a conditional trade. Buy confirmation through breadth, falling volatility and stable credit rather than assuming Friday marked the low.
Equities: Treat 7,650 as the binary filter. A close below it reactivates negative gamma; below roughly 7,493, CTA selling risk rises materially. The rebound case needs SPX to reclaim 7,700 to 7,720, then the 7,750 to 7,812 gamma-flip zone. If financials and healthcare lose their 50-day trends, rotation has become broad de-risking.
Gold & Silver: Stay constructive on gold, supported above $4,100 with 4,250 to 4,280 the recovery band. Silver is tougher: it needs to reclaim roughly 58.50 to 60 before this looks like a broad precious-metals recovery, while a failure below $54 would warn that industrial and liquidity stress is worsening.
Crypto: Treat the bounce as a pause in deleveraging, not proof it has ended. Bitcoin's hold of $80,000 favours a tactical bounce, but it needs a sustained close above $83,000 to reopen 84,000 to 85,000; a clean break below $80,000 exposes 77,500 to 75,000. Ether is weaker, with $2,500 the first repair level.
Macro: A December hike looks more plausible than an October one. Brent below $110 with narrowing diesel cracks is the constructive disinflationary combination; Brent above $110 with the heating-oil crack above about $90 would re-open the shock. Watch DXY as the confirmation gauge, below 101.5 says falling yields are in control, above 102.6 says inflation and funding stress are returning.
The market is not yet offering a clean risk-on or risk-off regime. It is offering a high-dispersion environment in which earnings quality, balance-sheet strength, pricing power and financing structure matter far more than index labels. Record highs are a normal feature of long-term compounding, but the next one will be earned only if the market converts strong earnings and supportive seasonality into broader participation without another leg higher in energy, yields or funding stress... stay disciplined, and trade carefully.
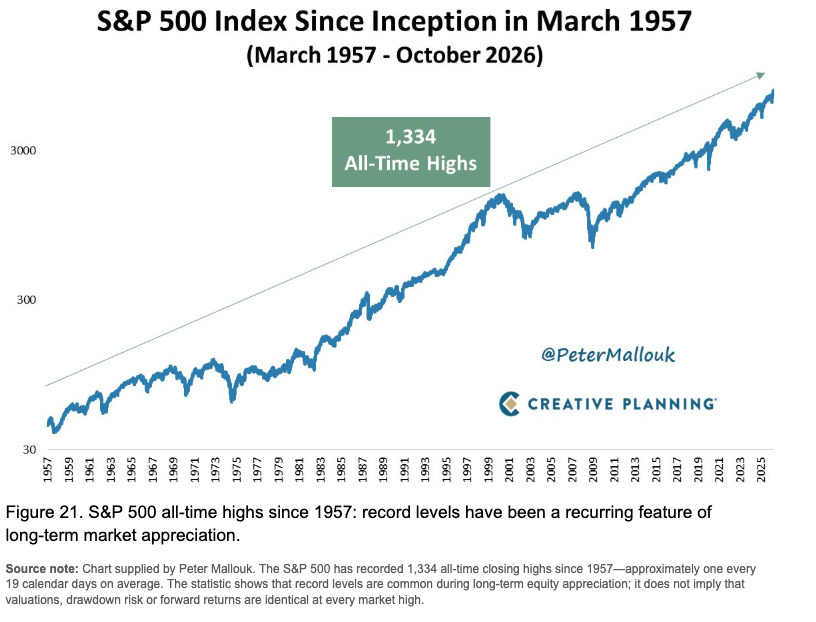
Charts and figures are from the 19 October 2026 weekly pack. This is a recap of that tape. It is not a personal recommendation, and nothing in it is guaranteed.