September hike odds fell to about 30% after a soft July CPI and a weak retail sales print. The 30-year still closed at 5.26%, the Russell made another high, and energy's week was large enough to dominate the sector tape. This is a market recap, not a recommendation to buy or sell.
Market overview
The Russell 2000 gained 1.1% and the desk marked another high. The S&P 500 added 0.4%, the Nasdaq-100 0.1%, and the Dow lost 0.6%. The S&P MidCap 400 tagged a Friday session high. Energy was the outlier, up 7.3% on the week. Take energy out of the sector board and the rest finished inside a 1.2% band, with consumer discretionary at the back.
Friday's volume was the fourth-lowest of the year. The VIX closed at 14.3, the lowest since December, consistent with about a 0.90% average daily move in the S&P 500 over the next 30 days. Options expiry falls this week, which is when a tape this quiet usually gets asked whether index hedges and correlations need to catch up. E-mini S&P volume has been running under 850,000 contracts.
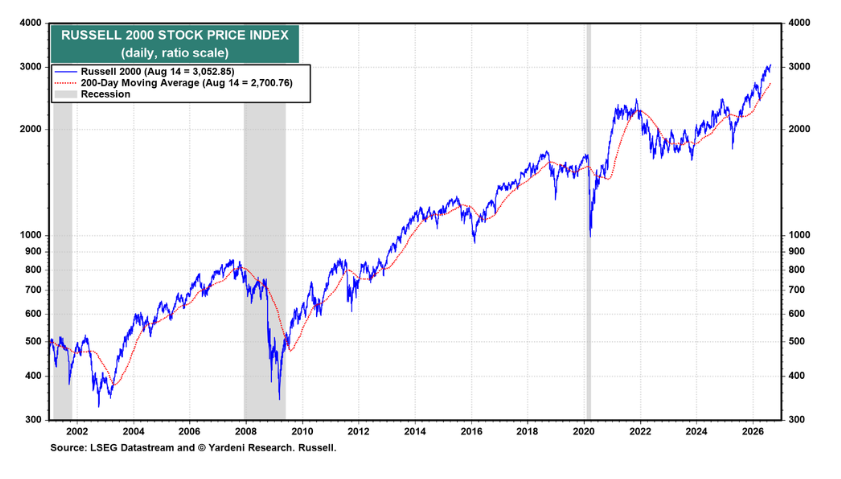
Russell 2000 at 3,052.85 on 14 August, against a 200-day average of 2,700.76. Source: Yardeni Research, LSEG.
Mohamed El-Erian's line for the week is the useful one. Even with the Fed minutes, this week's data is unlikely to close the gap between firmer equities, higher bond yields, lower hike odds, and softer consumer numbers.
Macro and policy: the September hike was marked down
CME pricing for the 16 September meeting, taken on 17 August, put a 65.4% chance on no change and a 30.6% chance on a hike from the current 3.50-3.75% target range to 3.75-4.00%. A week earlier the hike was priced at 52.2%. A month earlier it was 51.2%. The probability of an ease was 0.0%.
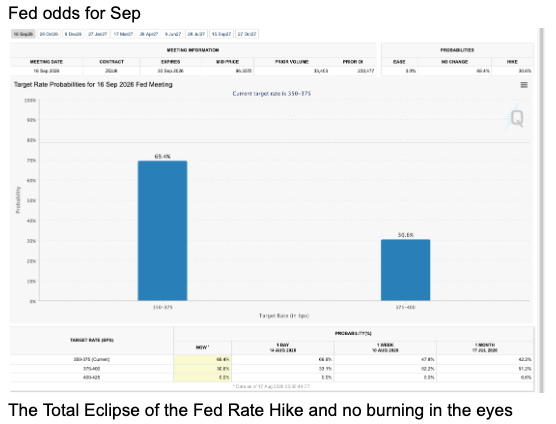
16 September meeting, as of 17 August: 65.4% no change, 30.6% hike, 0.0% ease. Current target 3.50-3.75%.
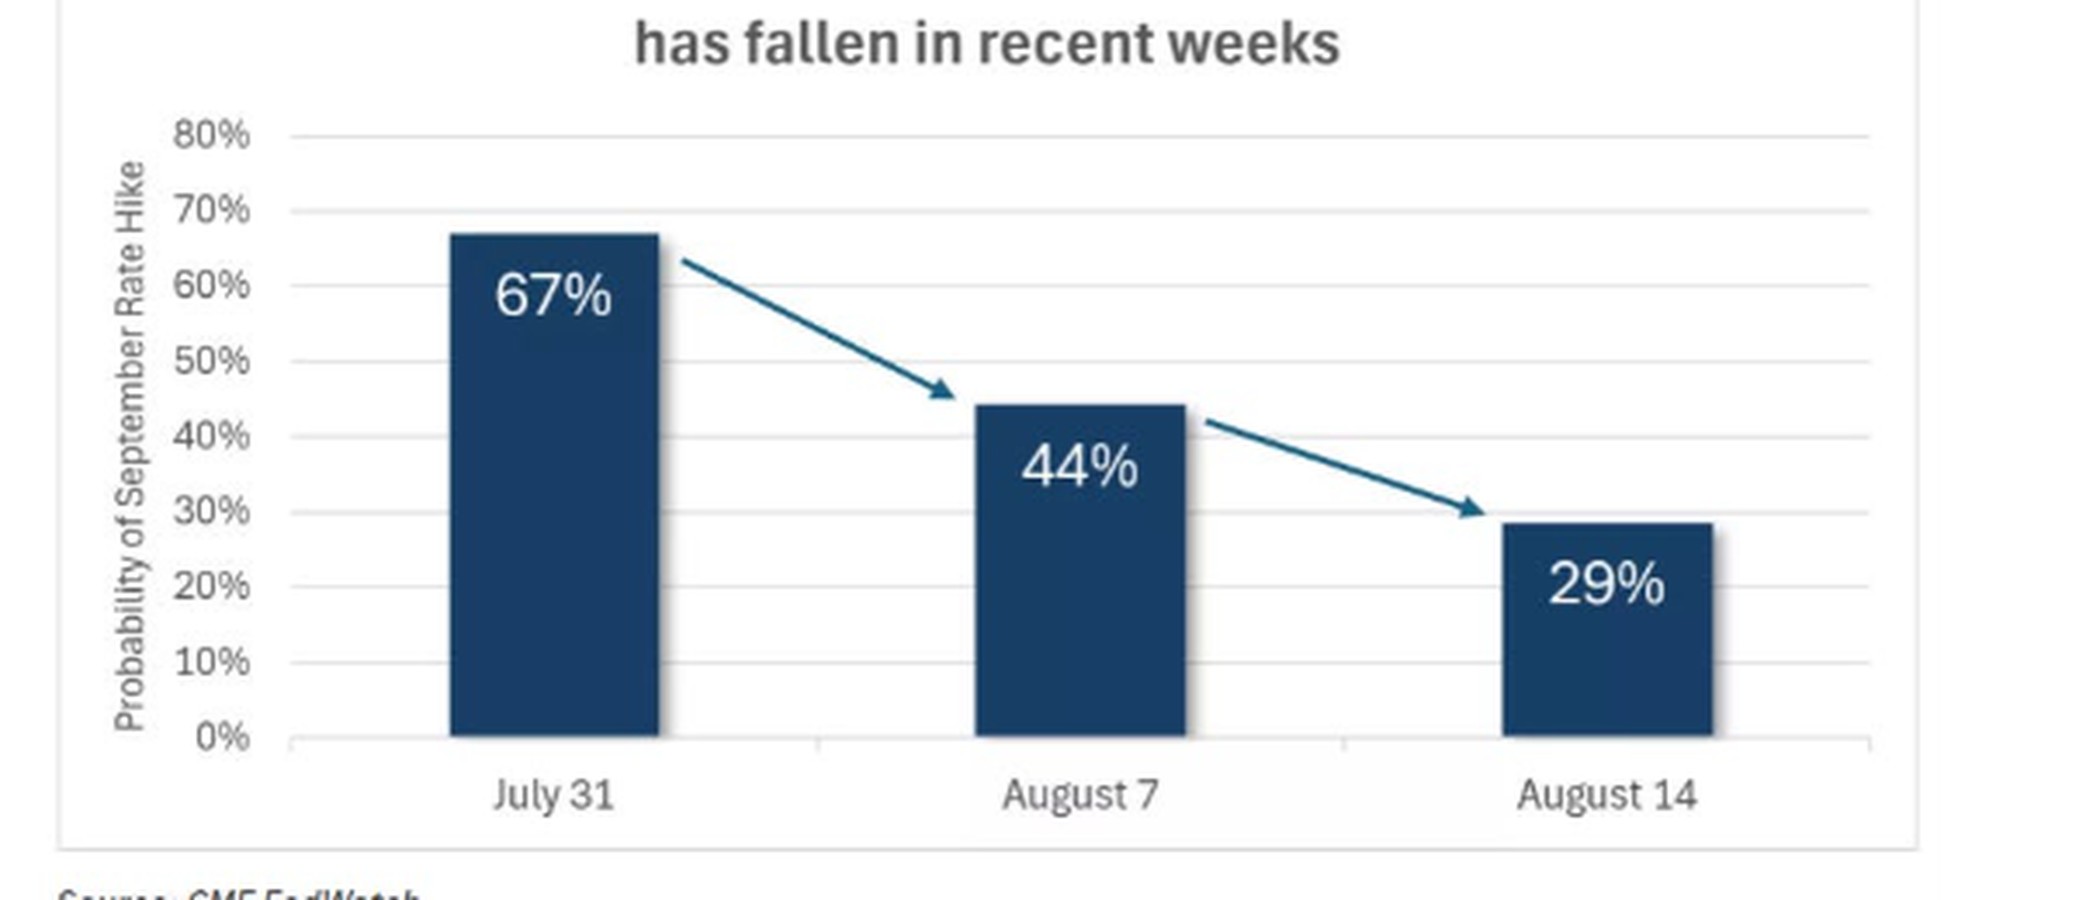
The slide into that print was steady. CME FedWatch had the September hike at 67% on 31 July, 44% on 7 August, and 29% on 14 August. Further out, the curve still prices hikes, fewer of them: about one 25bp move over the next six months and about one and a half over the next twelve, as of 14 August.
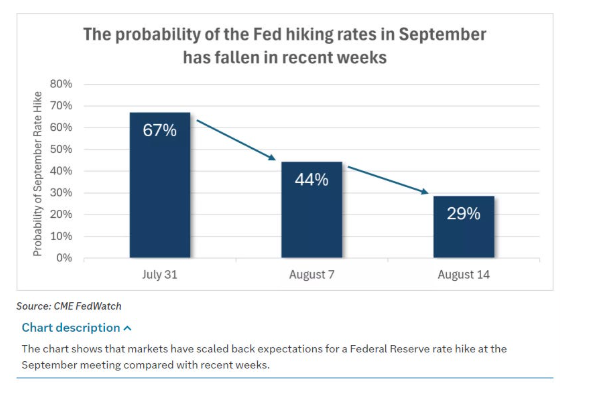
September hike probability: 67% on 31 July, 44% on 7 August, 29% on 14 August. Source: CME FedWatch.
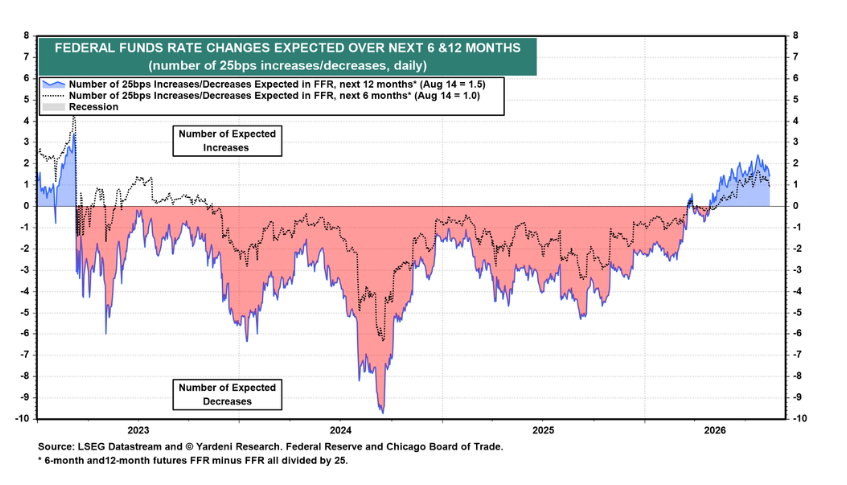
Expected fed funds changes, as of 14 August: about 1.0 move of 25bp over six months, about 1.5 over twelve. Source: Yardeni Research.
July core CPI rose 0.2% on the month. The monthly bars for goods excluding food and energy, and for services excluding housing and energy, both turned down.
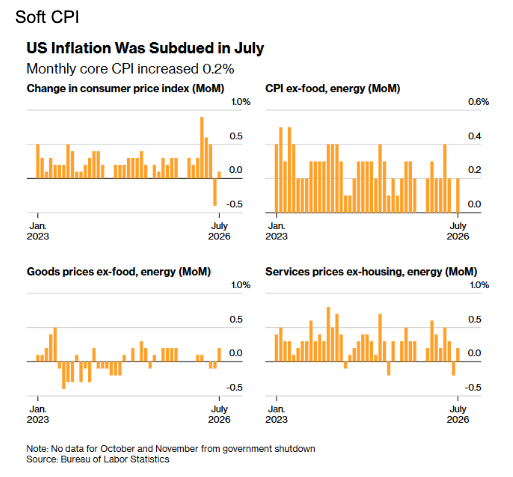
July inflation was soft. Monthly core CPI rose 0.2%. Source: Bureau of Labor Statistics.
Retail sales fell by the most in a year. Excluding autos and gas, the drop was the largest since January 2025. Online sales were a big part of the miss, and a chunk of that is calendar, not demand: Prime Day moved into June, so July lost the sales, and the seasonal factors still expected them in July. JPM's Feroli still looks for real consumer spending to grow at a 1.75% pace this quarter, down from 3.2% last quarter and close to trend. Control-group sales are still running at a 5.6% annualised pace over three months, and 4.6% over twelve. Early August Chase card data is pointing to a rebound. The New York Fed's household credit survey showed total debt slightly lower and early delinquencies steady. Credit more than 90 days past due is elevated, and the Fed's own economists put much of that on a change in bureau reporting.
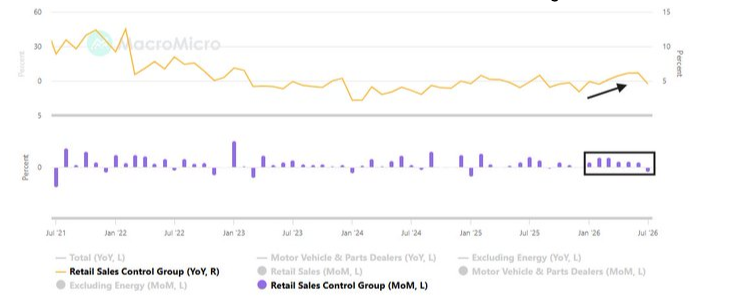
Retail sales control group, with the recent monthly prints boxed. The July miss sits on top of a still-firm year-on-year line.
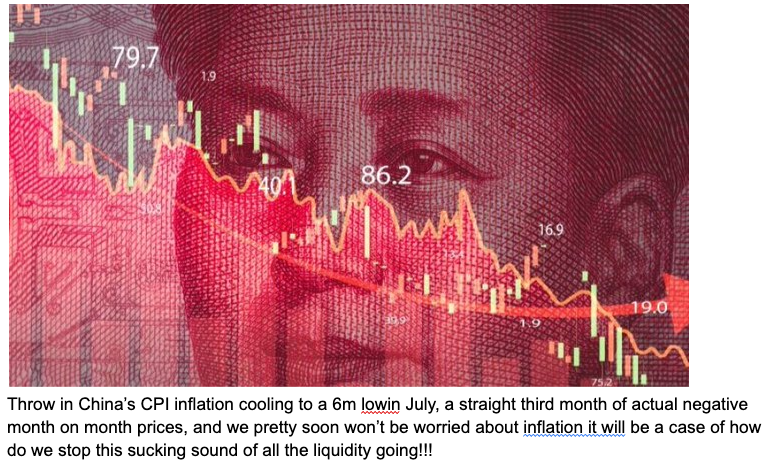
University of Michigan sentiment missed. Only 8% of consumers expect their income growth to beat inflation over the next year. Small-business optimism moved the other way, which fits a Russell tape that is still making highs. UK second-quarter GDP held up and gave sterling a bid. China's CPI and PPI are slowing together.
A 2001 auction yield, with breakevens unmoved
The 30-year auction cleared at the highest yield since August 2001. That older date was also the last 30-year sale until February 2006, when the worry was that budget surpluses would leave the market short of bonds. The worry now runs the other way. Interest expense for the fiscal year to date is $1.17 trillion, up 15%. In the latest refunding statement, Treasury stopped saying it was evaluating future "increases" in coupon sales and switched the word to "changes". The bond market read that as a possible trim at the long end. The 30-year still finished the week at 5.26%, consolidating in the same way USD/JPY did a few weeks ago. If it breaks to a new high on RSI divergence, the desk does not expect that high to hold.
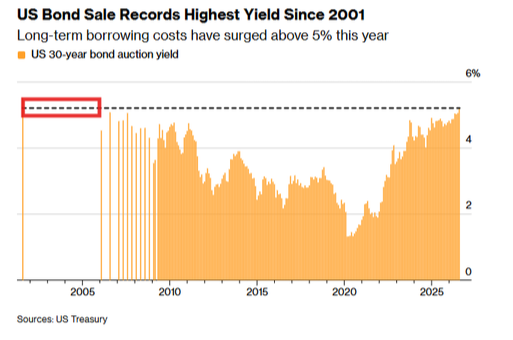
The 30-year auction yield at its highest since 2001, with long-term borrowing costs back above 5%. Source: US Treasury.
On the real-rate chart, as of 14 August, the 5y5y forward real yield is 2.72%. The 30-year breakeven is 2.24%, and it has sat between about 2.0% and 2.5% since 2021. Nominal yields are being marked up with the real rate. A nominal economy still growing near 6% can carry that. The desk's read is that the market is repricing the neutral rate above the 2% the Fed spent years treating as normal.
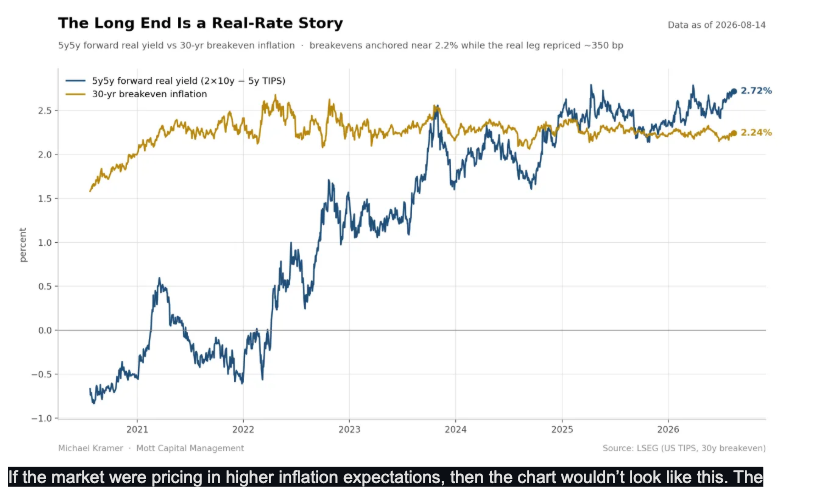
5y5y forward real yield at 2.72%, 30-year breakeven at 2.24%, as of 14 August. Source: Mott Capital, LSEG.
Dollar, oil, gold
The dollar index finished near 99.49, stuck between the 50-day and the 200-day and holding the 99.5 area. Four-hour MACD momentum has made a fresh low. EUR/USD held around 1.157 to 1.160, with the 50% retracement still overhead if that bounce is only setting up a turn. USD/JPY is tracking oil for now: the yen firms when oil falls and softens when oil rises, which is an awkward tape for the recent intervention to lean on. Sterling had the UK GDP print behind it. Commodity currencies, the Canadian dollar in particular, picked up a bid from the crude move.
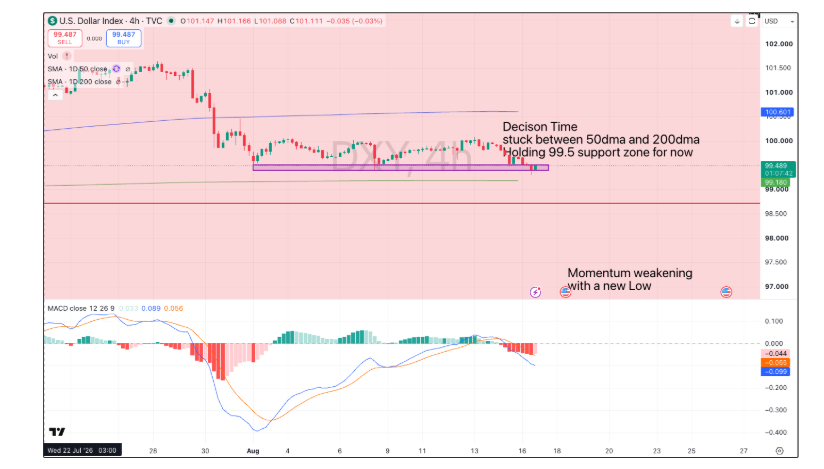
DXY near 99.49 on the 4-hour, pinned between the 50-day and the 200-day, with momentum making a new low.
Crude is being bid on Strait of Hormuz risk. The desk's levels are WTI toward about $81.50 and Brent near $88.50 to $89, with the mid-90s fade still holding the downtrend on the daily chart and a momentum test ahead. A diplomatic headline would take that premium out quickly, which is why the energy equity tape is so hard to read. Energy's support score hit 88.3 on 23 July, the strongest single reading on the board all summer. It was 54.0 two weeks later, bottomed at 47.0 on 7 August, and closed this week at 77.4, up 26.4 points from Monday. Three full reversals in a month. A ceasefire that takes the geopolitical premium out of oil is an odd companion to an energy sector that just had its best week since the first spike.
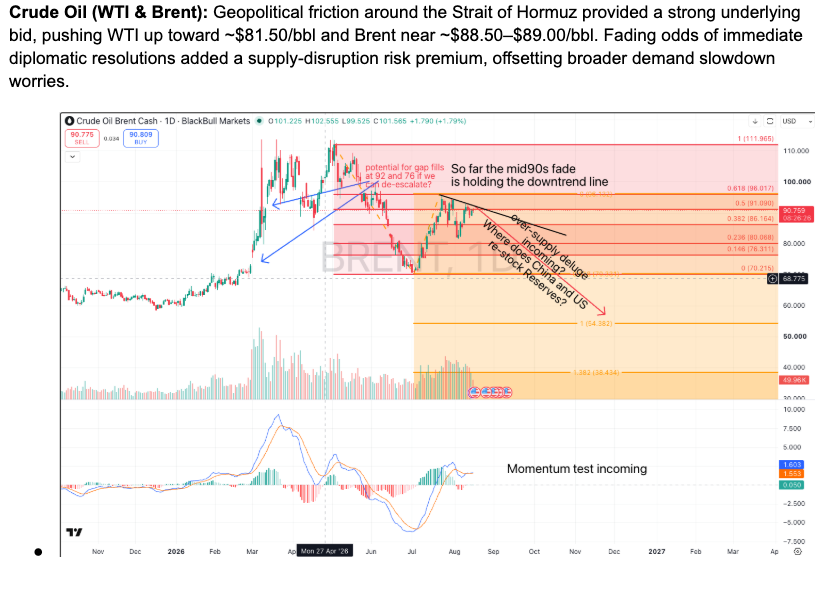
Brent daily. The mid-90s fade is still holding the downtrend, with a momentum test marked ahead.
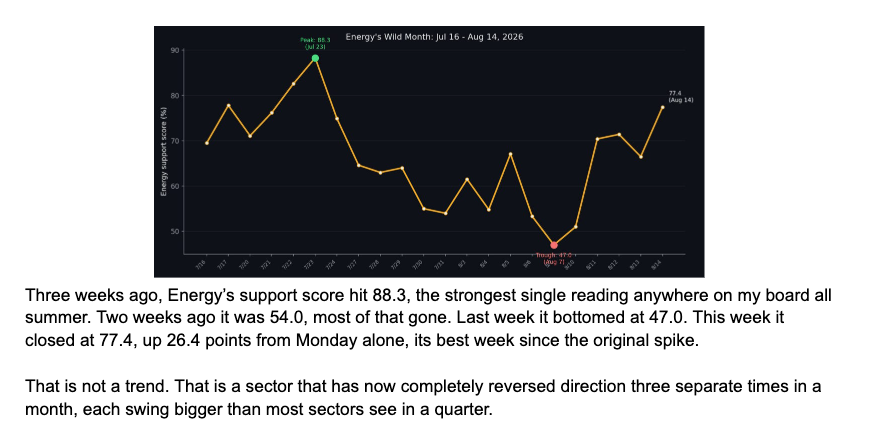
Energy support score, 16 July to 14 August: peak 88.3, trough 47.0, close 77.4. Three reversals in a month.
Gold held the $4,350 to $4,400 area. The daily chart is still inside its rising channel. The note on the chart says it still needs to break out of that channel, and on the same gradient it could be back toward $5,000 by year-end. Silver stayed in a $63 to $65 band. Bitcoin sat around $63,000 to $64,000 and ether under $1,900, with thin spot volume and ETF outflows in a $120 million to $140 million range. Crypto is about 1% of the world portfolio. That 1% is $2.61 trillion.
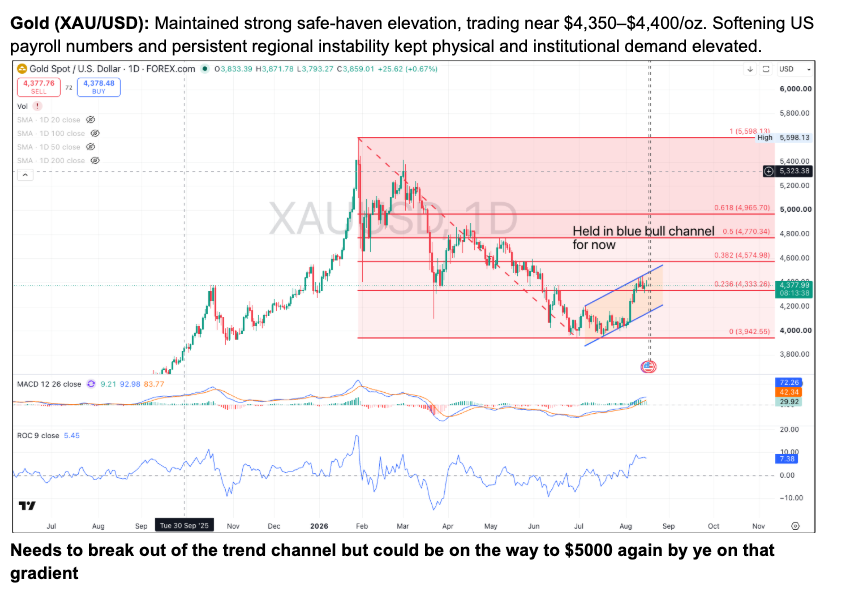
Gold daily, still inside the rising channel, trading in the $4,350 to $4,400 area.
Earnings are doing the work the multiple is not
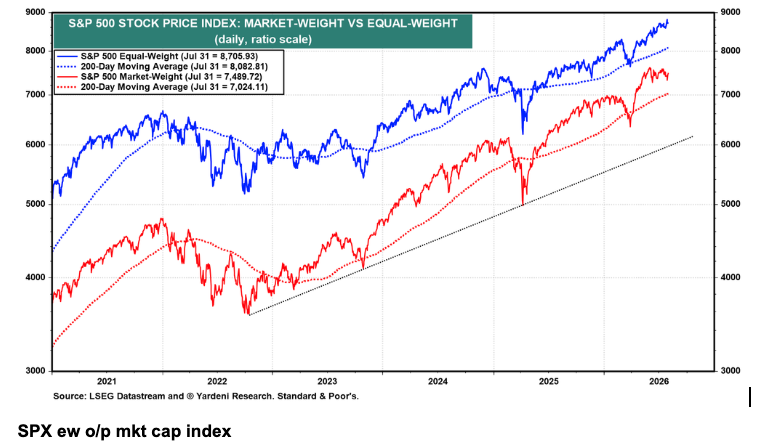
JPM's July cut of the top ten changes the 2000 comparison. Those ten names were 39.1% of S&P 500 market cap and 41.8% of trailing earnings on 31 July. Earnings weight has crossed back above the market-cap weight. Small-cap earnings are running hot alongside that. Strip out other income and the AI capex bulge, and Goldman still has earnings growth for the average stock near 10%. The S&P 500 is around 20 times earnings. The equal-weight index has caught up to about 17 times. Ex-Magnificent Seven names are still ahead on the year.
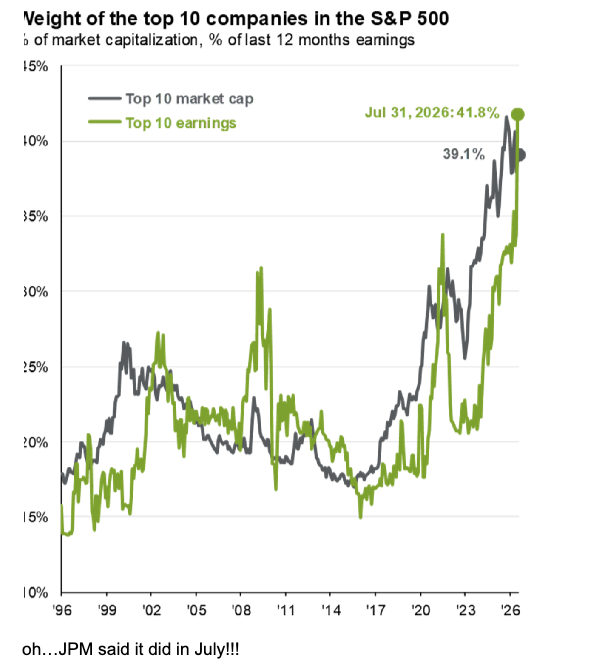
Top ten S&P names on 31 July: 41.8% of trailing earnings, 39.1% of market cap. Source: JPM.
Outside the US the gap is wider. All Country World ex-US forward earnings are up 36.9% year on year. Forward revenues are up 9.2%. Earnings are growing about four times faster than sales. Korea since the 30 July low is the version of that move you can see without a model. Inside the US, semiconductors had a sharp month: SanDisk is up 35.1% month to date, Marvell 18.4%, Micron 18.1%, all ahead of the Mag-7. Information-technology earnings are outrunning revenue, and the sector multiple has stayed subdued, which is what you tend to see when investors think the earnings peak is close. The backlog does not look like a peak yet.
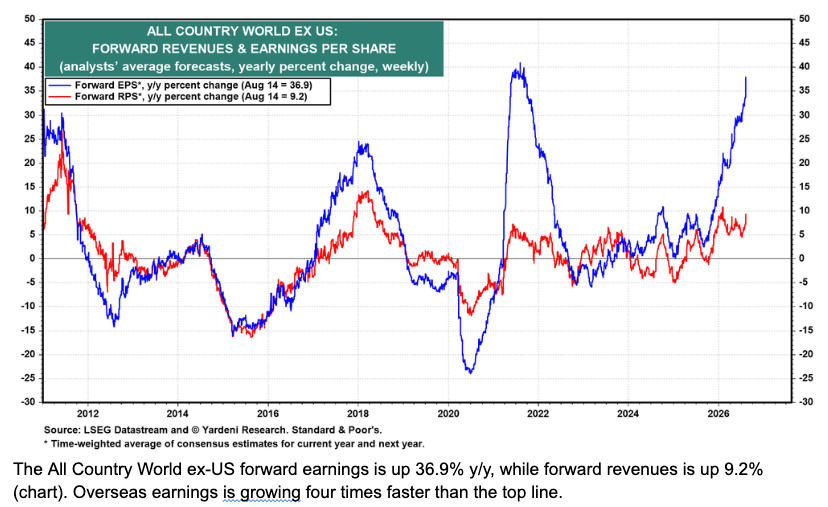
All Country World ex-US: forward earnings +36.9% year on year, forward revenues +9.2%, as of 14 August. Source: Yardeni Research.
Yardeni's year-end sketch is an S&P 500 at 8,400, which would be a fourth straight year of gains of 15% or more. The only five-year run of that kind was the late 1990s. The usual midterm pattern, a September base, is not the one in force, and the desk is treating it as a low-confidence guide this year. Consensus at 20 times is the arithmetic behind an index north of 8,000, if the earnings numbers hold.
Positioning is calm, which is its own information. Deutsche Bank has aggregate equity positioning at 0.25 standard deviations, the 58th percentile. Discretionary books are a touch under neutral, at minus 0.03 standard deviations. Systematic strategies are overweight, at 0.60 standard deviations, the 76th percentile. Average S&P 500 single-stock one-month implied volatility fell another 2.7 points this week and is down 12 points from the July peak, the lowest since January, after falling in six of the last seven sessions. The Citi Economic Surprise Index dropped to 15.0, with the 10-year yield up only 7bp over 13 weeks. Weaker retail sales and employment did the damage. On that index, yields can ease from here even while most investors still expect them higher. IPOs are at a four-year high.
The Week Ahead: Key Data and Market-Moving Signals
Retail earnings land on a soft July sales print, and consumer discretionary was already the laggard into Friday. The surveys that can move the growth read are Monday's Empire State, Thursday's Philly Fed, and Friday's flash PMIs. FOMC minutes arrive Wednesday. They were written before this week's odds move, so they are the prior baseline. Options expiry falls on Friday. The desk still has the Bank of Japan and the European Central Bank raising policy rates in September. Global 10-year yields are already high into that: Australia and the UK near 5%, the US at 4.69%, Germany at 3.20%, Japan at 2.88%.
Monday, August 17
- South Korea: Liberation Day
- UK: Rightmove House Price Index
- Japan: GDP (Q2)
- China: Industrial Production
- China: Retail Sales
- China: Fixed Asset Investment
- China: Unemployment Rate
- US: NY Empire State Manufacturing Index
- Canada: CPI & Core CPI
- US: NAHB Housing Market Index
- US: TIC Net Long-Term Transactions
Tuesday, August 18
- Australia: Westpac Consumer Sentiment
- UK: Unemployment Rate
- UK: Average Earnings Index
- UK: Claimant Count Change
- UK: Employment Change
- Germany: ZEW Economic Sentiment
- Eurozone: ZEW Economic Sentiment
- Eurozone: ECB's Lane Speaks
- Canada: Housing Starts
- US: Housing Starts & Building Permits
- US: Industrial Production
- US: Import & Export Price Index
- US: Pending Home Sales
- US: Atlanta Fed GDPNow
- US: API Weekly Crude Oil Stock
Wednesday, August 19
- Japan: Core Machinery Orders
- Australia: Wage Price Index
- UK: CPI & Core CPI
- UK: PPI & RPI
- Eurozone: ECB President Lagarde Speaks
- South Africa: CPI
- UK: House Price Index
- Eurozone: CPI & Core CPI
- Germany: 10-Year Bund Auction
- US: MBA Mortgage Applications
- India: RBI MPC Meeting Minutes
- US: Crude Oil Inventories
- US: 20-Year Bond Auction
- US: FOMC Meeting Minutes
Thursday, August 20
- Japan: Trade Balance, Exports & Imports
- China: Loan Prime Rate 5Y
- China: PBoC Loan Prime Rate
- Australia: Unemployment Rate & Employment Change
- Germany: PPI
- UK: CBI Industrial Trends Orders
- Eurozone: ECB Account of Monetary Policy Meeting
- US: Philadelphia Fed Manufacturing Index
- US: Initial Jobless Claims
- US: Continuing Jobless Claims
- US: Leading Index
- Canada: IPPI & RMPI
- US: 30-Year TIPS Auction
Friday, August 21
- Australia: Flash PMIs
- UK: GfK Consumer Confidence
- Japan: National Core CPI
- Japan: Flash PMIs
- India: HSBC Flash PMIs
- UK: Retail Sales
- France: Flash PMIs
- Germany: Flash PMIs
- Eurozone: Flash PMIs
- UK: Flash PMIs
- Canada: Retail Sales
- US: Flash PMIs
- Eurozone: Consumer Confidence
- US: Baker Hughes Rig Count
Takeaway
September is no longer priced as a hike. The long bond did not follow that repricing, because the auction and the real-rate chart are about where the neutral rate sits, and the 30-year breakeven is still 2.24%. Small caps and overseas earnings did more of the work than the Dow. Energy's 7.3% week sits on a support score that has reversed three times since late July. The prints that can move the next five sessions are China's Monday data, UK and eurozone inflation on Wednesday, the Fed minutes, and Friday's PMIs.
Equities
Russell 2000 at 3,052.85 and up 1.1% on the week. S&P 500 around 20 times earnings, equal-weight around 17 times. The top ten are 41.8% of trailing earnings and 39.1% of market cap. Friday's volume and a 14.3 VIX are the soft part of an otherwise broad tape.
Rates
30-year at 5.26% after the highest auction yield since 2001. 5y5y real rate at 2.72%. 30-year breakeven at 2.24%. September hike odds at 30.6%, with no ease priced.
Oil and gold
Hormuz risk is the bid under crude, with the desk at about $81.50 WTI and $88.50 to $89 Brent, and the mid-90s still the fade on the chart. Gold is inside its channel in the $4,350 to $4,400 area.
FX and crypto
Dollar pinned near 99.5 with momentum rolling over. Euro holding 1.157 to 1.160. Yen still trading with oil. Bitcoin around $63,000 to $64,000, light volume, small ETF outflows.
Charts and figures are from the 17 August 2026 weekly pack. This is a recap of that tape. It is not a personal recommendation, and nothing in it is guaranteed.