Weekly Market Outlook - November 2nd, 2026
The Market Wants Cash Before It Pays for AI, as Gold's $4,000 Floor Turns Into a Trapdoor
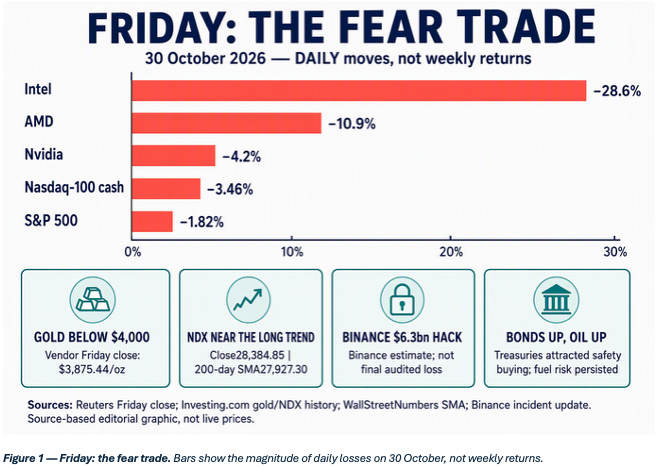
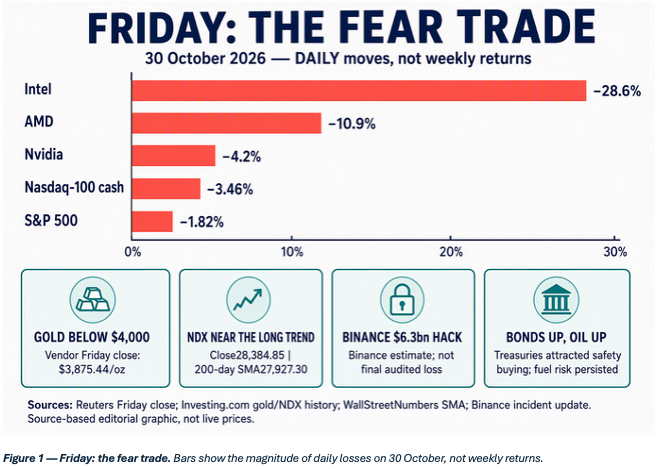
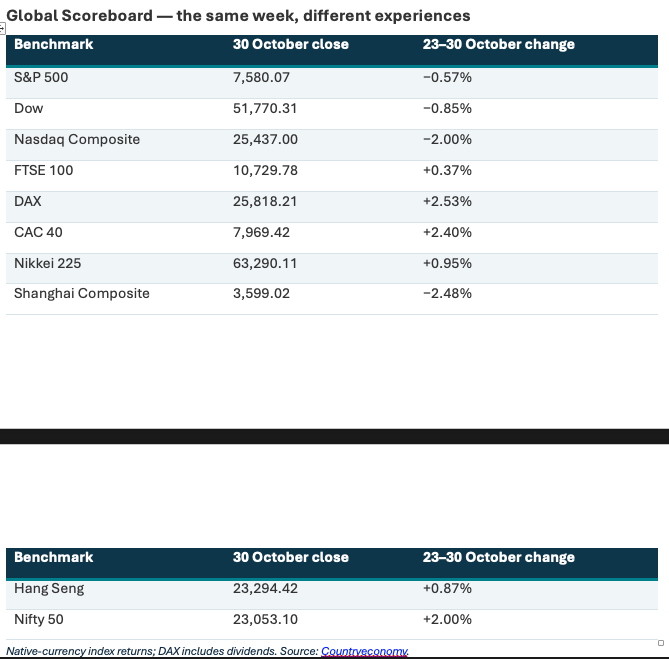
Last week started with a recovery and finished with a horror show. A three-session bounce ran into a wall of cash-burn questions, chip selling and expensive oil. Friday-to-Friday, the S&P 500 lost 0.57% to 7,580.07, the Dow fell 0.85% to 51,770.31, and the Nasdaq Composite slipped 2.00% to 25,437.00. Those numbers hide a violent finish. On Friday alone, the cash Nasdaq-100 fell 3.46%, Intel collapsed 28.6%, AMD lost about 10.9%, and Nvidia fell 4.2%. For anyone concentrated in the AI winners, the modest weekly decline badly understates how Friday felt.
That is the change worth watching. Strong demand is no longer enough: Amazon's AWS grew 39.3%, yet investors stared at a $42.4 billion trailing-year free-cash-flow outflow. Gold broke $4,000 even as Treasuries attracted buyers, and the Binance hack, put at about $6.3 billion, added a custody shock to a risk-off day. Still, the selling was concentrated, with the Russell 2000 up 1.29% and Europe finishing higher. The AI boom is real, and so is the financing bill. The market now wants to know who gets paid, who pays for the kit, and what is left afterwards.
Market Overview: A Technology Reset Hiding Inside a Split Scoreboard
The headline understated the distance between winners and losers. Cash NDX lost 1.98% on the week, but Friday alone took 3.46% off it, so the earlier rebound softened the weekly number without softening the closing shock. Abroad, the DAX rose 2.53%, the CAC 40 2.40% and the Nifty 50 2.00%, while the Shanghai Composite fell 2.48%. Banks and industrials gave Europe a very different experience from US megacap tech.
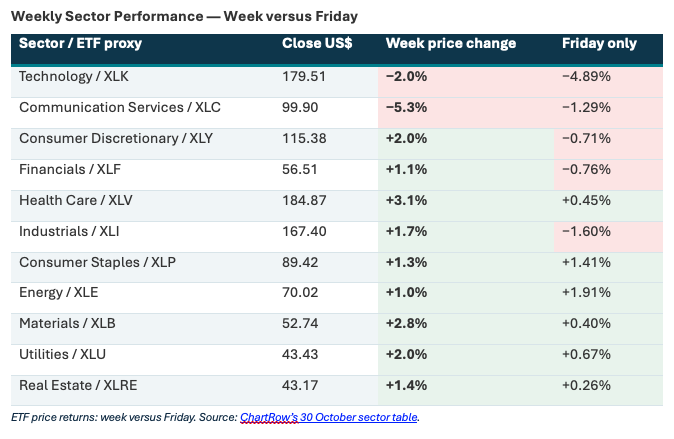
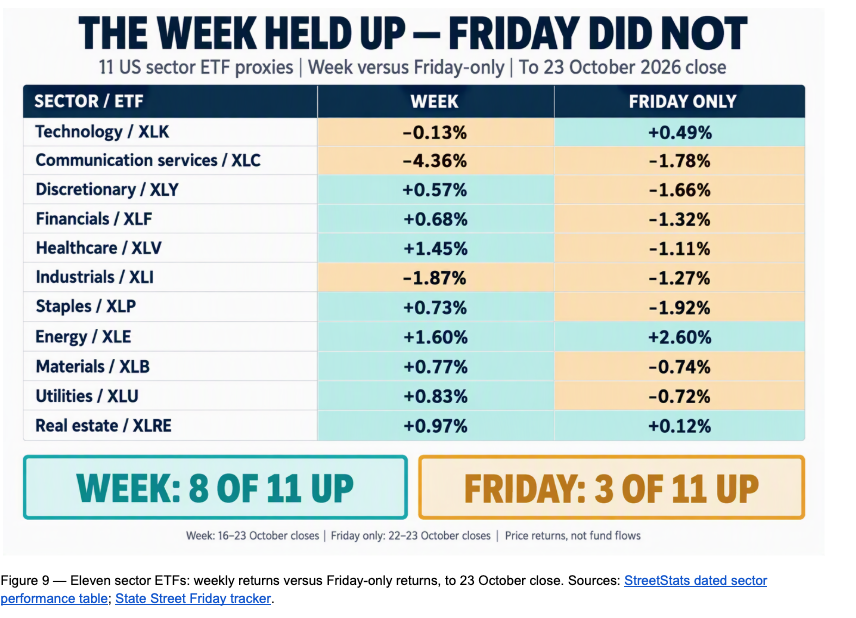
Nine of eleven sector proxies gained over the week. Communication services (down 5.3%) and technology (down 2.0%) were the exceptions, while health care rose 3.1% and materials 2.8%. On Friday, technology fell 4.89% as energy, staples and utilities rose. Financials and industrials still slipped, and that is the rotation test: if the cushions hold, the index can absorb an AI reset; if they join the selling, the problem becomes broader.
Breadth improved, but concentration has not been broken. RSP gained 0.82% against SPY's 0.56% decline, and equal weight beat cap weight by 5.9% in October, the second-largest outperformance on record after April 2009. Over three years, though, equal weight still trails by 9.8%. That is encouraging broadening, not yet a confirmed leadership change.
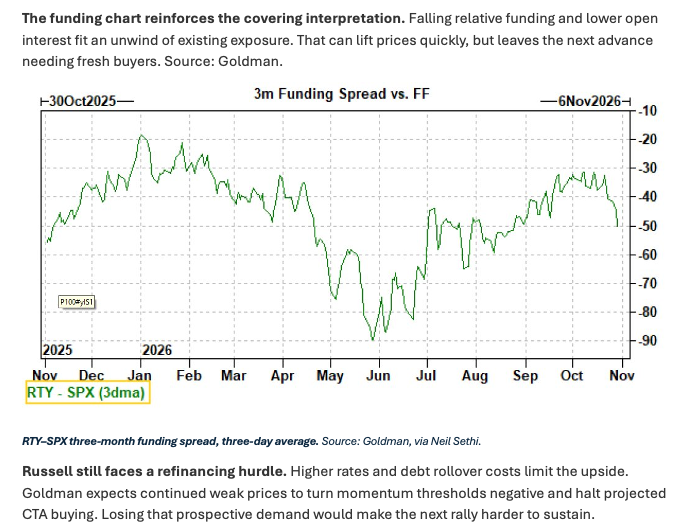
The Russell rally looks more like short covering than fresh conviction. Open interest fell by $2.1 billion and three-month funding cheapened as shorts closed and recent longs took profits rather than chased. That can lift prices quickly, but the next advance needs fresh buyers, while higher rates and debt rollover costs still cap the upside.
Macro & Policy Watch: The Fed Paused, Inflation Didn't, and Fuel Keeps Leaking Into Everything
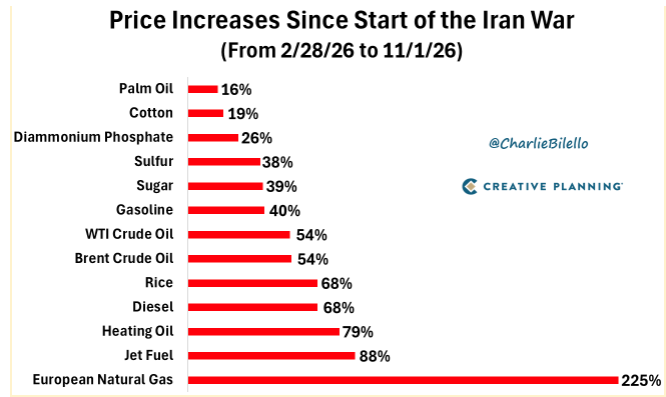
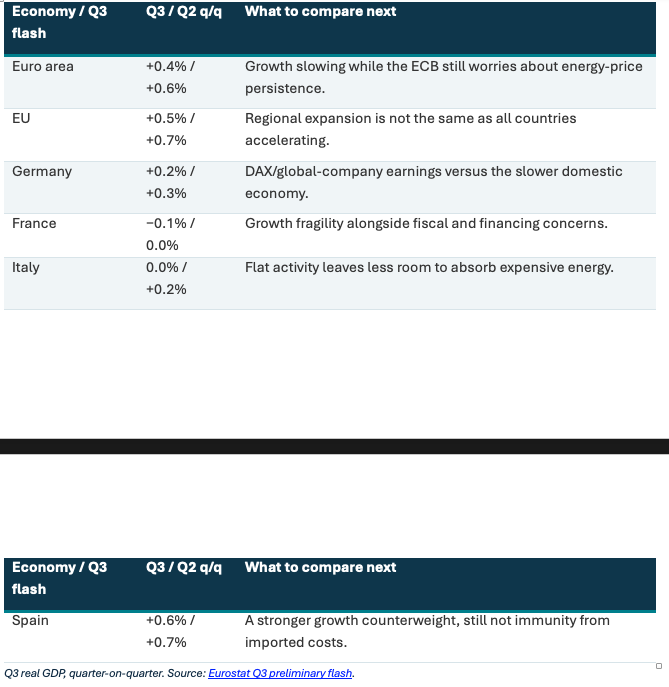
Growth is not dead, but neither is the inflation squeeze. Q3 real GDP grew 3.4% annualised, up from 2.2%, yet September's inflation-adjusted spending barely rose while headline PCE reached 3.6% and core 3.1%. Firms can report higher sales while customers get little more for their money. China's factories also slipped below the expansion line, so the global picture is split rather than synchronised.
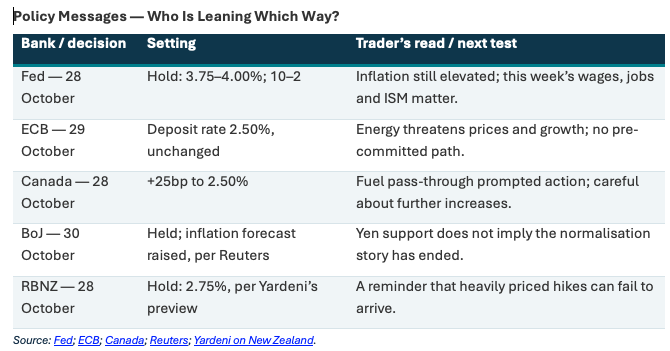
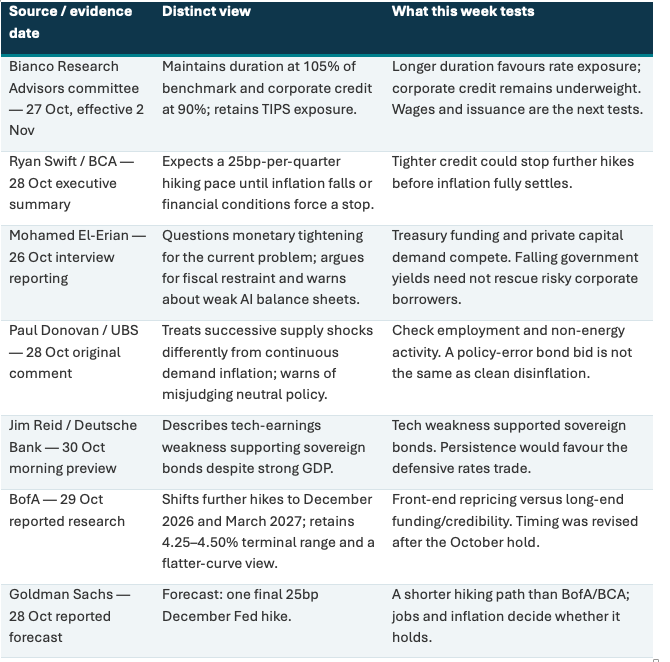
The Fed paused, but the next hike stays in play. Rates were held at 3.75% to 4.00% on a 10-to-2 vote, with Lisa Cook and Beth Hammack preferring a quarter-point rise. Canada actually raised by 25bp to 2.50% as fuel pass-through prompted action. The ECB held at 2.50% while warning that a longer energy shock lifts inflation and lowers growth, and the BoJ held but raised its inflation forecast. This is not central banks riding to the rescue. It is a country-by-country argument over how long fuel costs keep leaking into everything else.
Oil was the awkward extra shock. Friday's tanker attack in Hormuz kept the physical-supply question alive, with escalation fears after the US midterms supporting crude. Falling equities alongside dearer fuel is a miserable mix for importers. Safe tanker passage and cheaper freight would offer more convincing relief than another diplomatic headline. The market can price a peace headline; it cannot unload a tanker with one.
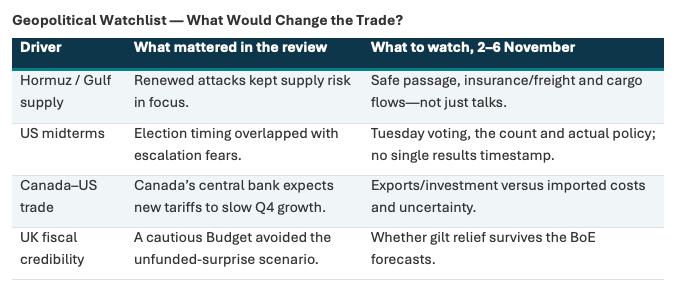
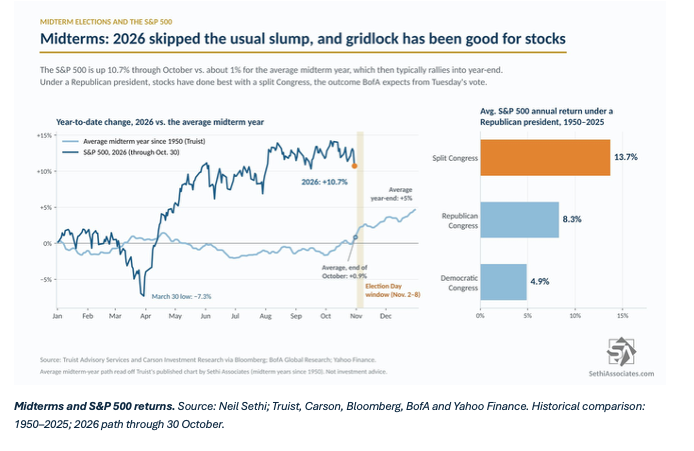
The midterms bring a more constructive historical thread. The S&P 500 was up 10.7% through 30 October, well ahead of Truist's average midterm-year path, and Wells Fargo's record shows positive S&P returns in the twelve months after every post-war midterm. Kalshi favours a Democratic sweep while bank strategists prefer gridlock. The catch is that this year's strong start leaves less weakness to recover, and each outcome could move AI, healthcare, defence, financials and industrials differently.
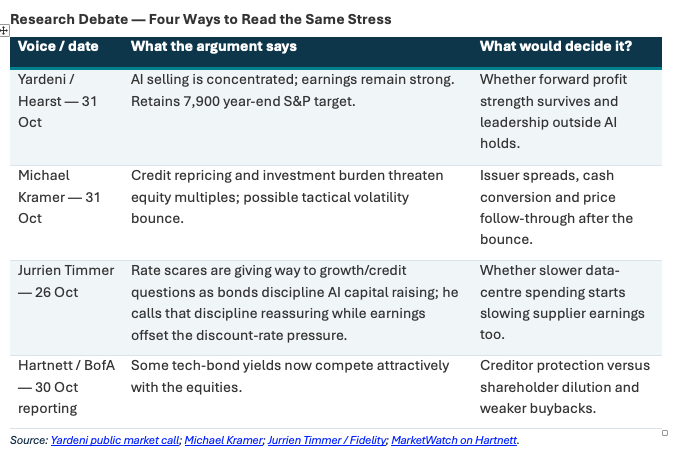
Bonds caught the falling knife; corporate funding is a different knife. The ten-year Treasury finished at 4.931%, down 5.8 basis points on Friday, and the UK Budget cut planned long gilt sales by £7.7 billion. But CTAs have only closed their bond shorts, not turned long. Hartnett now finds some 6% to 8% tech-bond yields attractive enough to compete with the shares, and France paid more than the US for ten-year funding for the first time in over a decade.
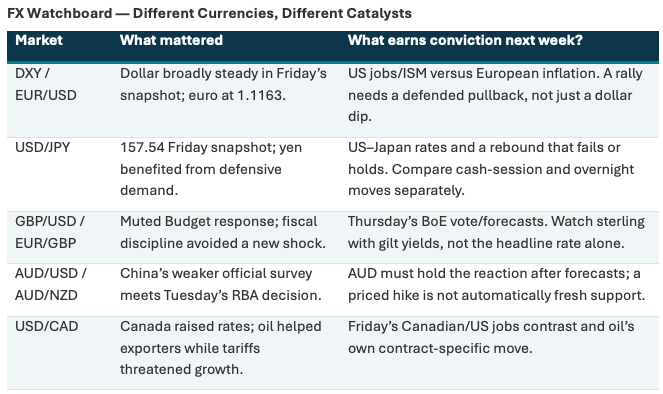
Falling yields with deteriorating credit would send a very different message from falling yields with calmer inflation and healthy funding. In FX, the haven trade favoured the yen over the dollar, with USD/JPY at 157.54 and EUR/USD at 1.1163, while sterling now needs its own argument ahead of Thursday's BoE.
Technical & Sentiment Breakdown: Supportive, but Increasingly Fragile
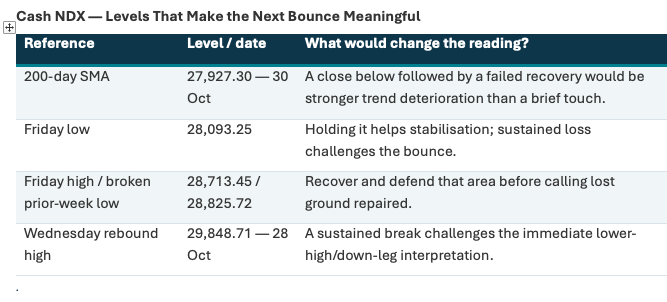
Nasdaq is testing its long-term trend support rather than breaking it. Cash NDX closed at 28,384.85, 1.64% above its 27,927.30 200-day average, after Friday's 28,093.25 low came within 0.59% of it. The index sits below its 50-day average with weaker momentum. A hold would give buyers a foothold; a close below the 200-day followed by a failed recovery would leave the longer trend in trouble.
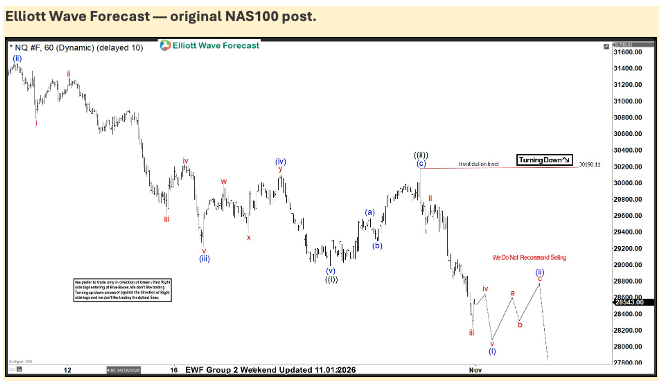
The first ground to recover is Friday's 28,713.45 high and the broken 28,825.72 prior-week low, with Wednesday's 29,848.71 high the bigger test. The wave analysts lean lower: EWM allows a rebound toward roughly 28,600 before weakness toward 28,250, and Filighera sees a new five-wave fall developing. The question is not whether it bounces, but where the bounce fails.
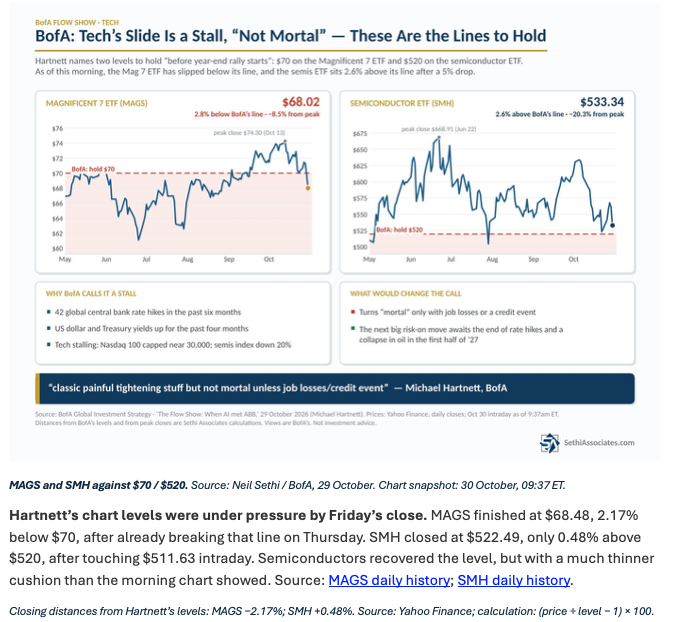
Leadership checkpoints are thinning. MAGS closed at $68.48, 2.17% below Hartnett's $70 line, while SMH held just 0.48% above $520 after trading at $511.63. On the other side, Deutsche Bank sees a relative-value opening after over 16 percentage points of tech underperformance in three weeks, and Wilson notes Apple's correlation with Nasdaq turning negative for the first time. Stock selection still matters while the index is under pressure.
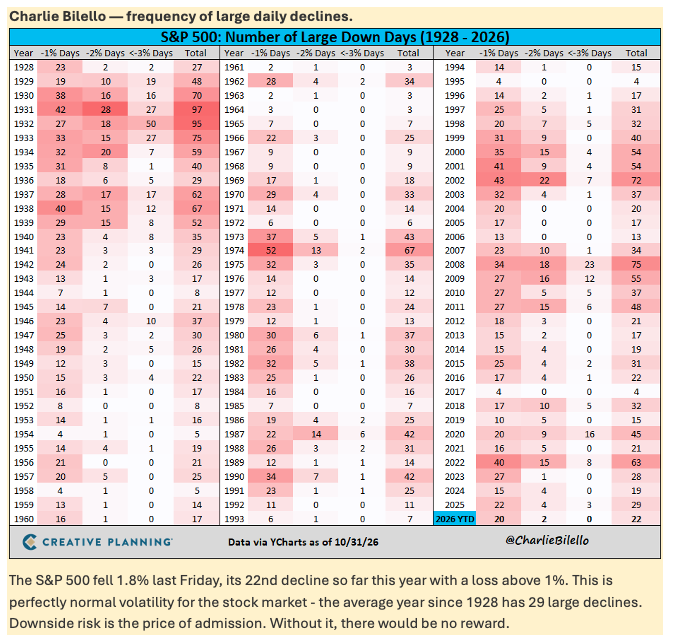
Scary times are not a proven bottom. Friday's 1.8% S&P 500 fall was only the year's 22nd daily loss above 1%, against an average of 29 since 1928. AAII already showed 37.8% bulls and 41.4% bears before Friday. A painful session is not the same thing as capitulation.
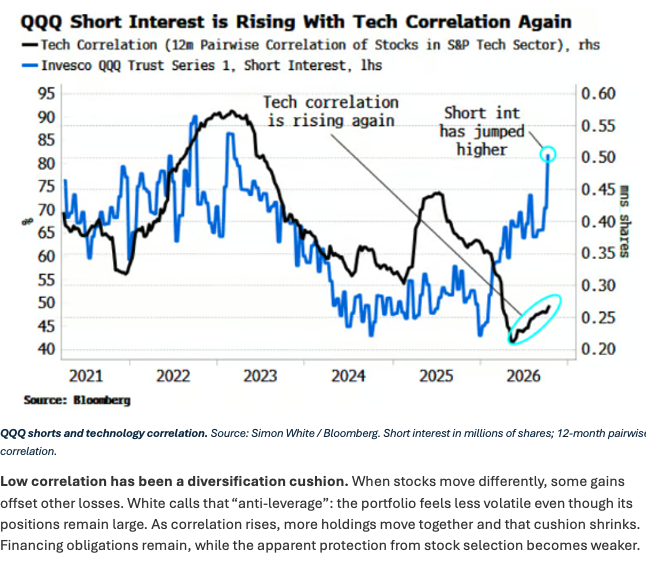
The consensus risk sits in positioning. Traders poured nearly $1 billion into a 3x leveraged Nasdaq-100 ETF after Friday's drop, the fifth-largest inflow on record. Hedge funds are keeping core AI longs while adding index hedges, and rising technology correlation is shrinking the diversification cushion. That leaves both short-covering fuel and a sharper downside if stocks keep moving together.
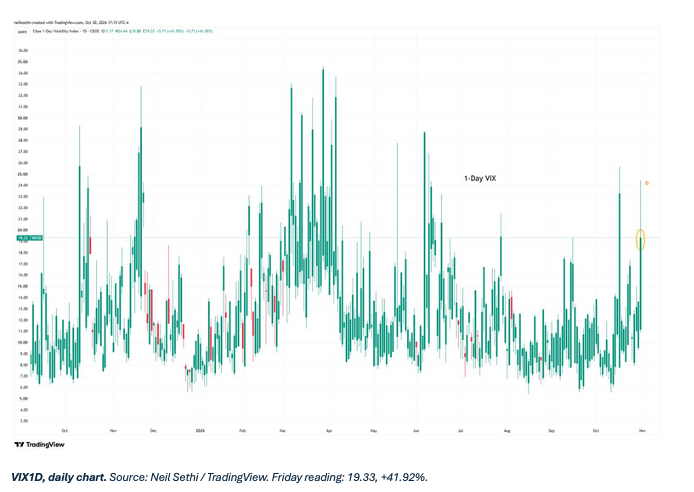
Volatility repriced fast. VIX1D jumped 41.92% to 19.33, its second-highest Friday close since June, and QQQ moved far more than options had priced. November dealer gamma is still estimated at about -$54.0 billion per 1% SPX move, so hedging can amplify a rebound as easily as another fall. Kramer expects one-day volatility to ease, but sees the broader VIX staying around 19 rather than back at its old lows.
Last Week's Recap: Resilient Growth, Sticky Prices and a Haven Trade That Left Gold Behind
A week where growth refused to roll over, and inflation refused to fade. Bonds rallied, gold broke, crude climbed, and crypto had its custody nerves tested, all while earnings season delivered strong growth with a tiny forgiveness budget.
Key Highlights
Macro
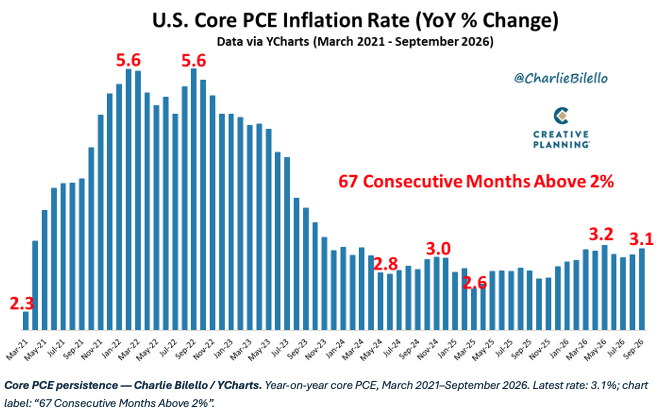
The consumer is leaning on wealth rather than income. Real consumption grew at a 3.8% annual rate for a second quarter despite tepid real-income growth, and Feroli links that to equity gains, so a sustained correction could hit spending too. Core PCE has now run above 2% for 67 consecutive months. JPMorgan expects Q4 growth to ease to a 1.75% pace, with 75,000 payrolls on Friday, a slowdown rather than a labour-market break. Europe grew 0.4% after 0.6%, with France contracting slightly and Italy stalling.
China
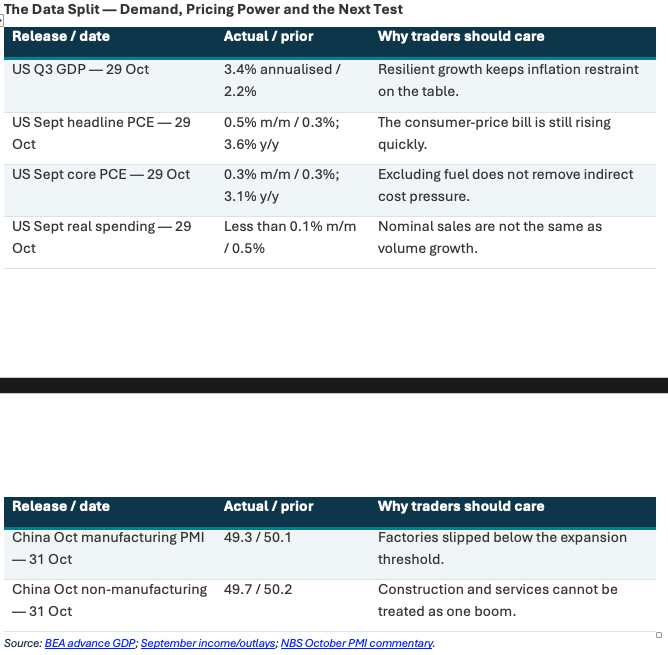
China's factories slipped below the expansion line. The official manufacturing PMI fell to 49.3 from 50.1 and non-manufacturing to 49.7, with new orders at 49.4. Yet high-tech manufacturing held at 51.3, and smaller firms were notably weaker than large ones. That is a split economy, where selected tech demand keeps running while the wider domestic engine sputters. Shanghai fell 2.48% on the week.
Earnings
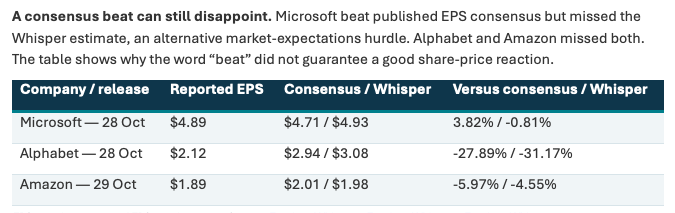
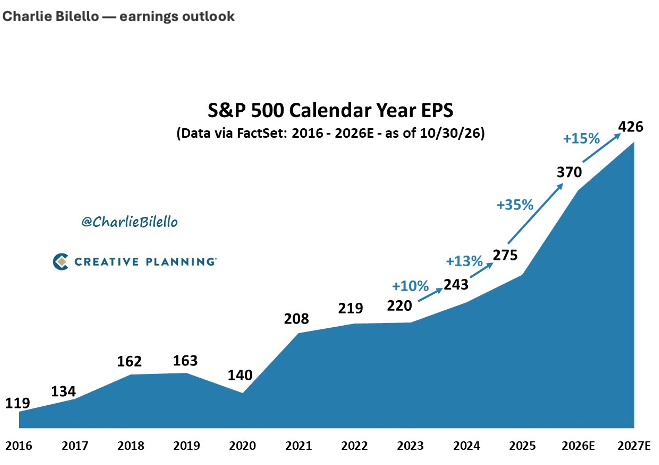
The season is strong; the forgiveness budget is tiny. With 60% reported, 82% beat EPS estimates and blended growth reached 30.2%, but the aggregate surprise was only 1.9% against a 7.5% five-year average. Amazon's trailing-year free cash flow was -$42.4 billion and Alphabet's quarter burned about $9.07 billion. Microsoft beat consensus but missed the Whisper, while Alphabet and Amazon missed both. Profits are still growing fast, on pace for 35% in 2026 and 15% in 2027. Exxon and Chevron rose on refining-led profits, offering real alternatives to the AI trade.
Commodities
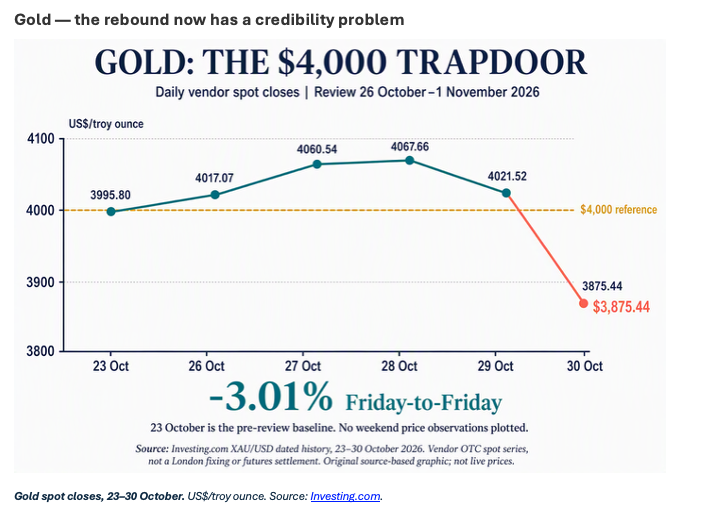
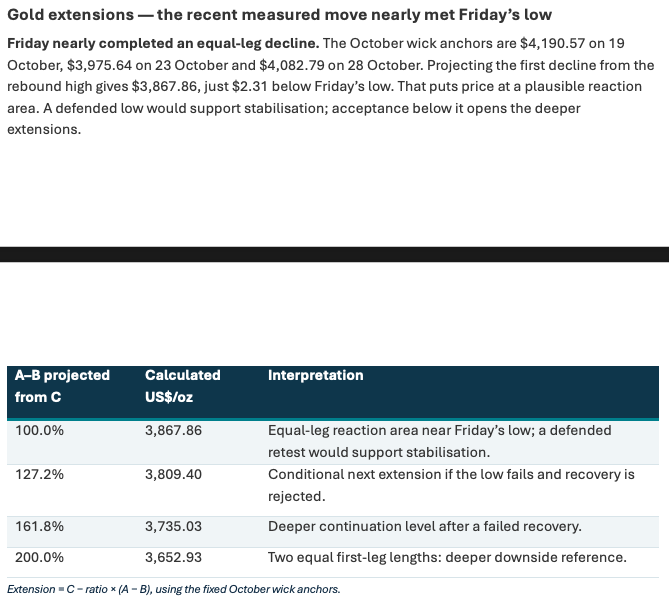
Gold's $4,000 floor became a trapdoor. Spot closed at $3,875.44, down 3.01%, after touching $3,870.17, and silver slipped below $50. December futures closed with RSI at 27.92, below the usual oversold threshold, leaving room for a sharp bounce. Shapiro thinks gold is being sold to raise cash, as in the 2008 and 2020 liquidation phases. Friday's low also sat just $2.31 above the $3,867.86 equal-leg projection, a plausible reaction area.
Crypto
Binance reopened with the trust damage still fresh. About $6.3 billion was affected, and around 95% was covered from Binance's own resources, which is replacement rather than recovery. The FBI's attribution to North Korea added a geopolitical edge. Sunday brought a $3.6 billion net outflow from the exchange as customers used the reopened exit. Money leaving the exchange is not necessarily money leaving crypto.
Oil
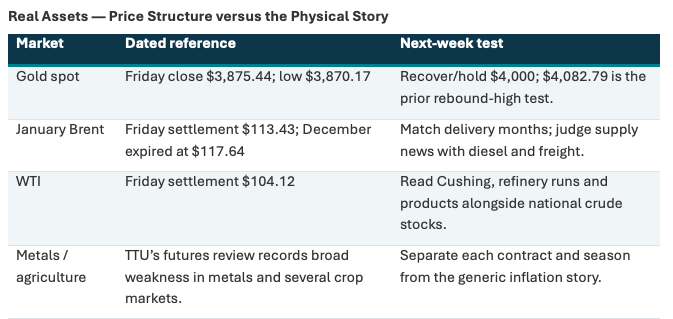
Crude and bullion were not sharing one inflation trade. December Brent expired at $117.64, and January settled at $113.43, while WTI settled at $104.12. Diesel is where the squeeze becomes practical, as refining margins add to inflation beyond crude alone. Hauliers, factories and fuel retailers care about the delivered product, so safe passage and cheaper freight matter more than any single headlin
The Week Ahead: Key Data and Market-Moving Signals
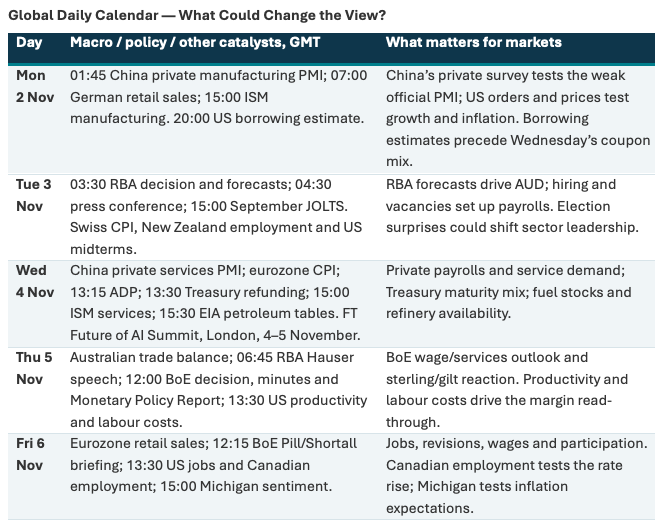
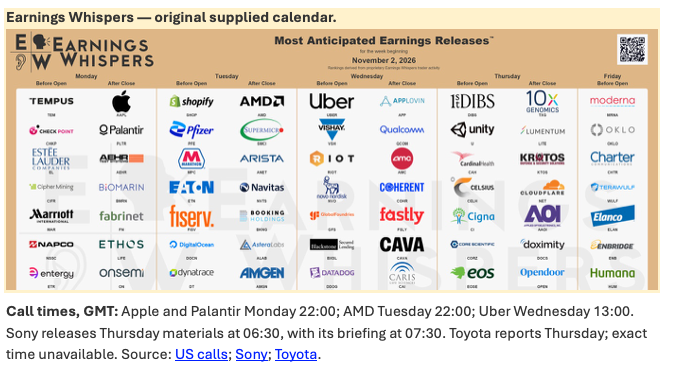
A week when confidence is the real opening question. The RBA, BoE, Copom and Banxico decide on policy, the US votes in the midterms, and Apple, AMD and Qualcomm test the AI cash story before Friday's payrolls set the rates response. Earnings also reach well beyond AI, with 143 S&P 500 reporters covering an estimated 18% of index earnings. By Friday, the market will have a fresh read on whether resilient growth is cooling cleanly or making inflation harder to tame. Calendar times are GMT.
Monday, November 2
- China: Private Manufacturing PMI
- Germany: Retail Sales
- Latin America: Market Holidays in Brazil, Mexico & Colombia
- US: Marriott, Estée Lauder & Check Point Earnings
- US: ISM Manufacturing
- US: Senior Loan Officer Survey
- US: Treasury Borrowing Estimate
- US: Apple & Palantir Earnings
- US: ON Semiconductor, Roku & Williams Earnings
Tuesday, November 3
- Australia: RBA Rate Decision, Forecasts & Press Conference
- Switzerland: CPI
- New Zealand: Employment
- US: Shopify, Pfizer, Eaton & Apollo Earnings
- US: JOLTS Job Openings (Sep)
- US: Midterm Elections
- US: AMD, Arista & Super Micro Earnings
- US: Booking & Amgen Earnings
Wednesday, November 4
- China: Private Services PMI
- Eurozone: CPI
- UK: FT Future of AI Summit, London (4 to 5 November)
- Europe/US: Novo Nordisk, Uber & McDonald's Earnings
- US: CVS, Datadog & GlobalFoundries Earnings
- US: ADP Employment
- US: Treasury Quarterly Refunding
- US: ISM Services
- US: EIA Petroleum Inventories
- Brazil: Copom Rate Decision
- US: Qualcomm, Arm & AppLovin Earnings
Thursday, November 5
- Japan: Sony & Toyota Earnings
- Australia: Trade Balance
- Australia: RBA Hauser Speech
- UK: BoE Rate Decision, Minutes & Monetary Policy Report
- US: Cigna & Cardinal Health Earnings
- US: Productivity & Unit Labour Costs
- Mexico: Banxico Rate Decision
- US: Airbnb, Cloudflare & Atlassian Earnings
Friday, November 6
- Eurozone: Retail Sales
- UK: BoE Pill & Shortall Briefing
- US: Moderna, Humana & Charter Earnings
- US: Nonfarm Payrolls, Unemployment & Wages
- Canada: Employment
- US: Michigan Consumer Sentiment
Alpha Takeaway: The Market Wants Cash, and the Next Bounce Has to Earn Trust
This looks like a cash and confidence problem, not yet a broad liquidation. There is enough hedging to fuel a bounce, but enough common risk to make another fall sharper.
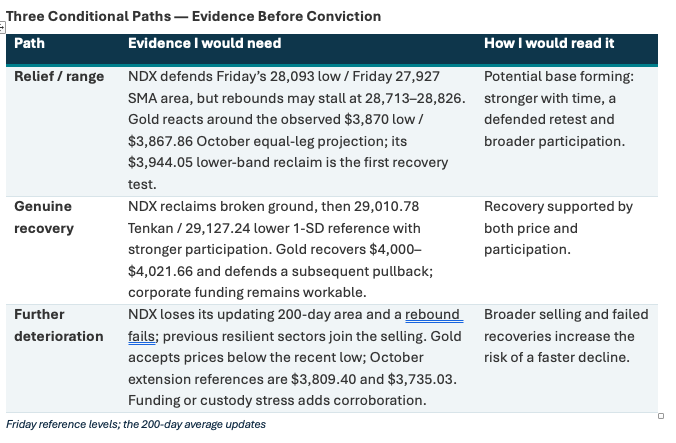
Equities: Friday's 28,093.25 low and the 27,927.30 200-day average frame the test for Nasdaq. Reclaiming 28,713 to 28,826 and then holding a higher low would show real repair. MAGS regaining $70 and SMH defending $520 would add weight. If banks, defensives and small caps join technology lower, the story has moved beyond rotation.
Gold & Silver: Gold needs to recover the $3,944.05 lower band first, then the $4,000 to $4,021.66 cluster. A defended low near $3,867.86 would support stabilisation, while acceptance below it opens $3,809.40 and $3,735.03. Silver's slide below $50 shows the pressure reached beyond gold.
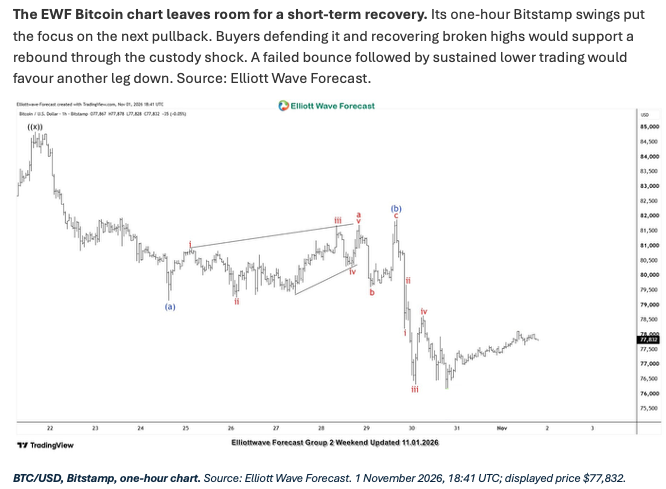
Crypto: Treat the reopening as relief, not a rewind. Working withdrawals, asset replenishment and reserve confidence are the tests. Buyers defending the next Bitcoin pullback and recovering broken highs would support a rebound, while continued exchange outflows would keep trust in focus.
Macro: The cleaner outcome is firm demand with less price pressure. The less comfortable one is weak orders with stubborn fuel inflation. Read ISM prices, wages and unit labour costs before calling a policy rescue. Lower government yields help, but companies still need to raise money on workable terms, and cheaper diesel would matter more than cheaper crude.
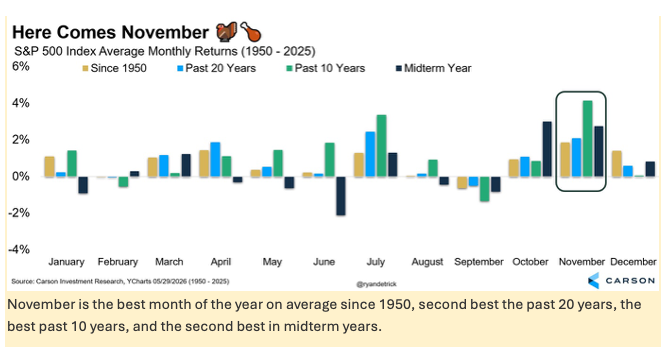
A tactical rebound can arrive before the daily trend repairs, and November's seasonal history is a tailwind, not a guarantee. The bottom line: a rebound that holds, broader leadership and steady funding would argue for recovery, while rejected bounces, fresh lows and weaker credit would argue the other way. Remember that a first bounce, a workable trade and a genuine trend turn can arrive at very different times. Stay cautious but open to a relief rally, know exactly where your idea fails, let the next pullback prove itself, and trade carefully in a week this loaded.
Charts and figures are from the 2 November 2026 weekly pack. This is a recap of that tape. It is not a personal recommendation, and nothing in it is guaranteed.