Weekly Market Outlook - November 16th, 2026
The Index Shrugged Off Nvidia's CEO Exit, as Real Yields Pushed Gold Below $3,900
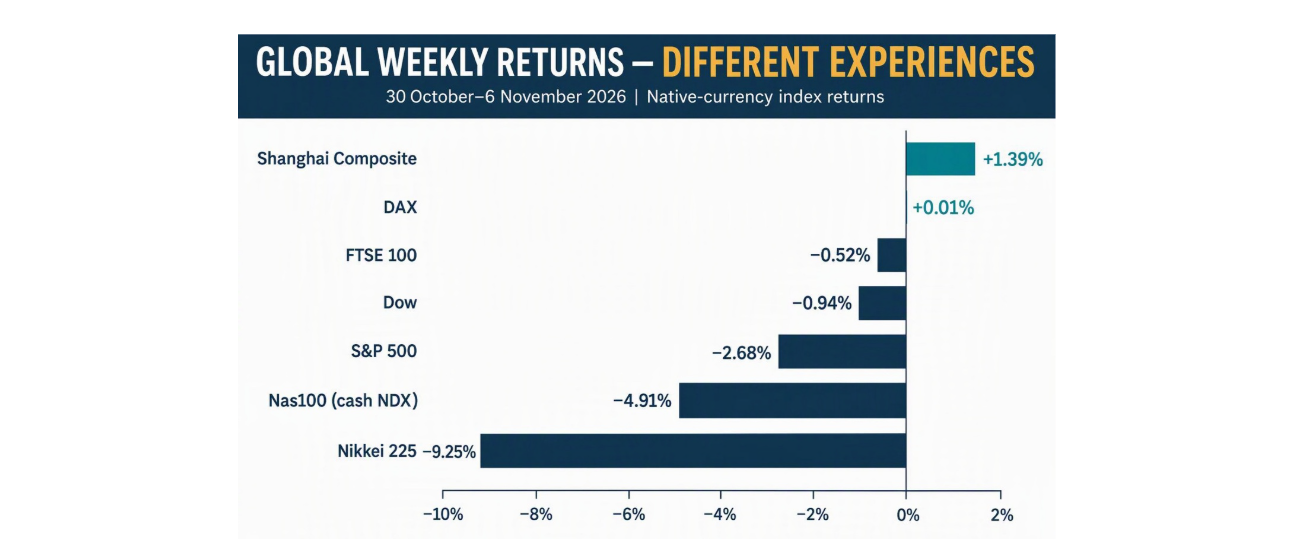
Last week the market lost its most important CEO and rallied anyway. Friday-to-Friday, the S&P 500 gained 2.51% to 7,561.67, its best week since August, while the Nasdaq-100 rose 3.53% to 27,943.74 and the Dow added 2.07% to 52,347.55. All eleven sectors rose, and 401 of 502 S&P stocks finished higher, even as Nvidia fell 12.75% after Jensen Huang resigned. Without Nvidia, the S&P would have been up roughly 3.7%.
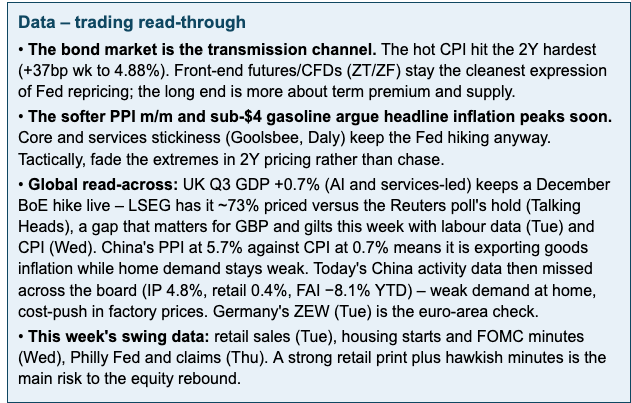
That is the change worth watching. A hot October CPI lifted the 2-year by 37bp to 4.88%, and the 10-year by 30bp to 5.154%, and FedWatch now puts about 89% on a December hike. Beneath the rebound, G10 excess liquidity sits at its lowest since 2024, and NDX slipped back below its 200-day on Friday. Rotation is real, but rates are now the constraint, and equity rallies are being sold into rate spikes.
Market Overview: Rotation, Not Risk-Off, Inside the AI Trade
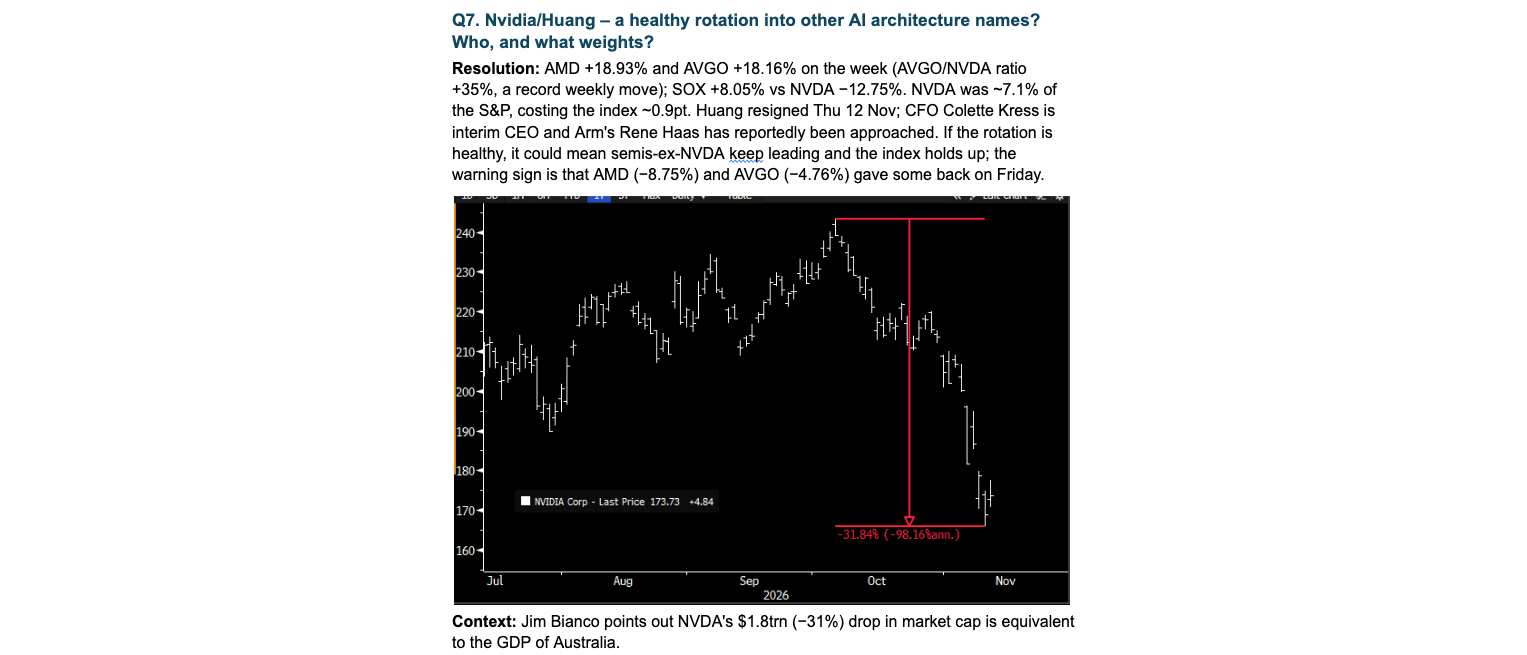
The damage stayed inside one name. AMD rose 18.93% and Broadcom 18.16%, SOX gained 8.05%, and the AVGO/NVDA ratio jumped 35%, a record weekly move. At roughly 7.1% of the S&P, Nvidia alone cost the index about 0.9 percentage points. Jim Bianco points out that its $1.8trn drop in market value is equivalent to the GDP of Australia.
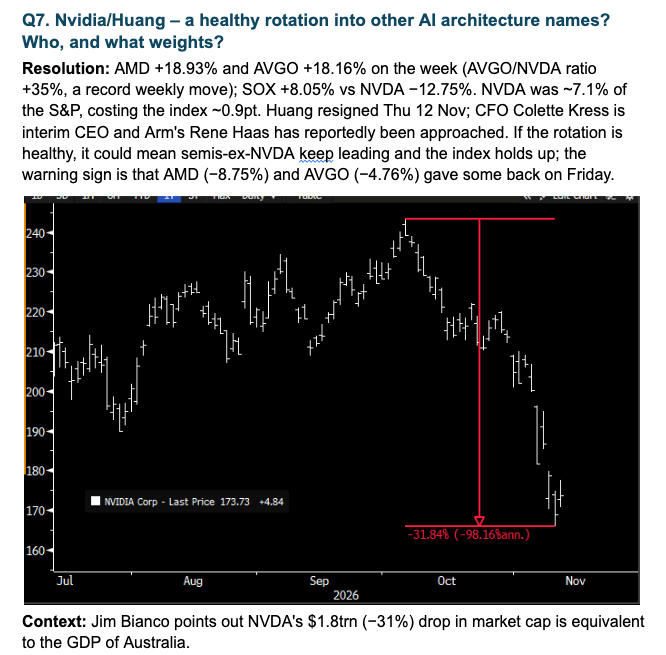
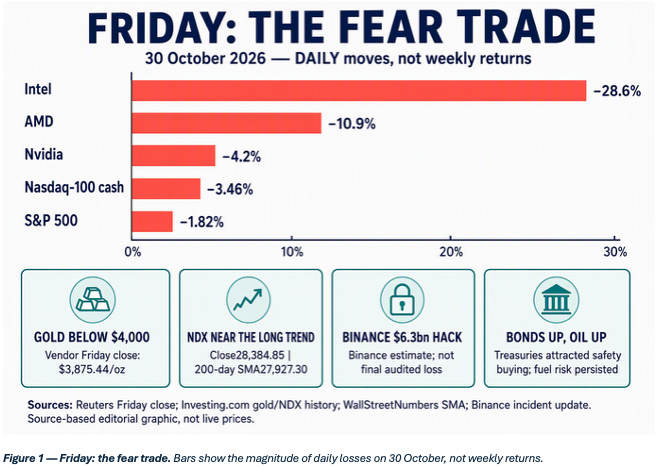
Friday the 13th lived up to its reputation, but it was rotation rather than a crash. The S&P lost 0.40% and NDX 1.2%, while the Dow was the only major index up. Tech fell 2.01% as staples rose 1.42%, and equal weight beat cap weight by more than 60bp.
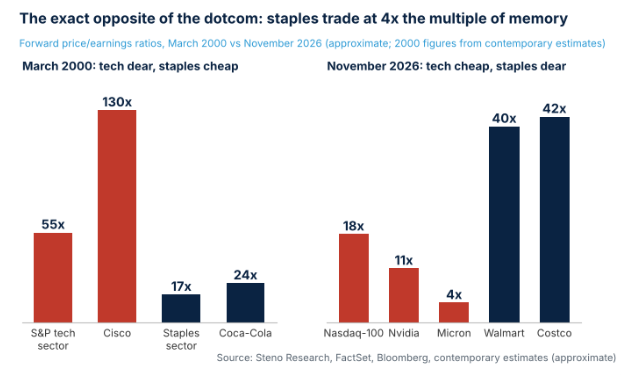
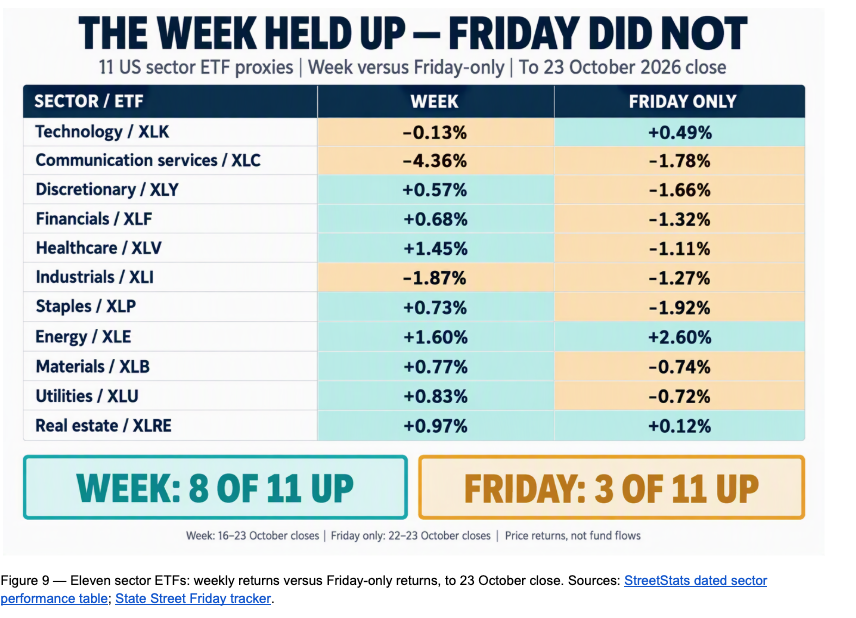
The latest rotation ranking leans defensive. Health care, staples and energy sit on top, with tech, industrials and communication services at the bottom. That reads as classic late-cycle hiding from rate risk: the AI trade is being trimmed rather than abandoned, but the rebound may be starting to lose breadth.
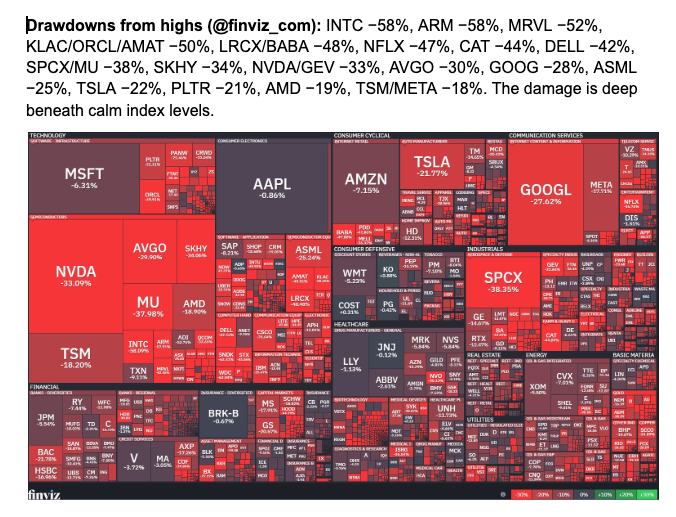
Flows and conviction are pulling in opposite directions. Retail is extremely bullish, with ten major US equity ETFs taking $37.5bn in five sessions. Institutions are clean: CTAs have swung from near +150% to -5% equity exposure. And the damage is deep beneath calm index levels, with Intel and Arm 58% off their highs, KLA and AMAT 50%, and Nvidia 33%.
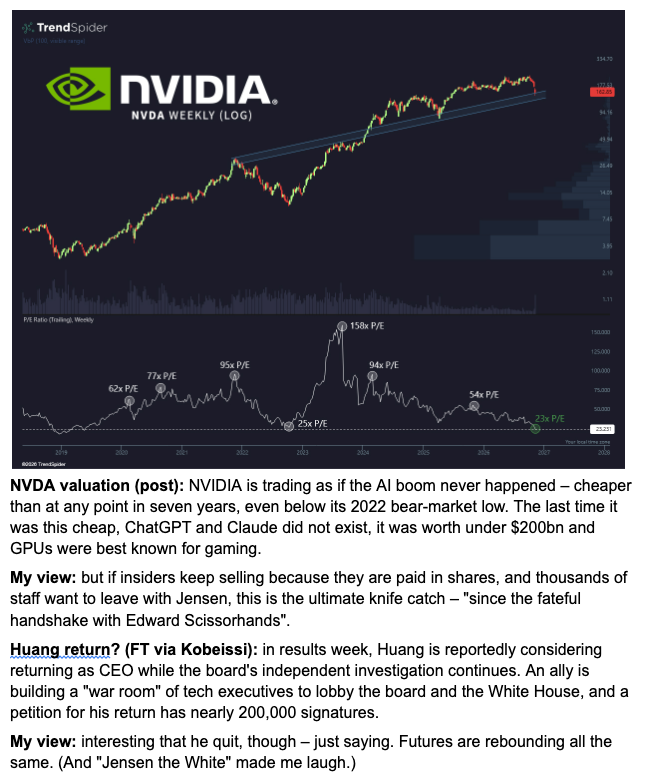
Nvidia is now trading as if the AI boom never happened, cheaper than at any point in seven years and below its 2022 bear-market low. But if insiders keep selling because they are paid in shares, and thousands of staff want to leave with Jensen, this is the ultimate knife catch. Interesting that he quit, though, just saying. And "Jensen the White" made me laugh.

Macro & Policy Watch: A Hawkish Fed Now Treats AI as an Inflation Story
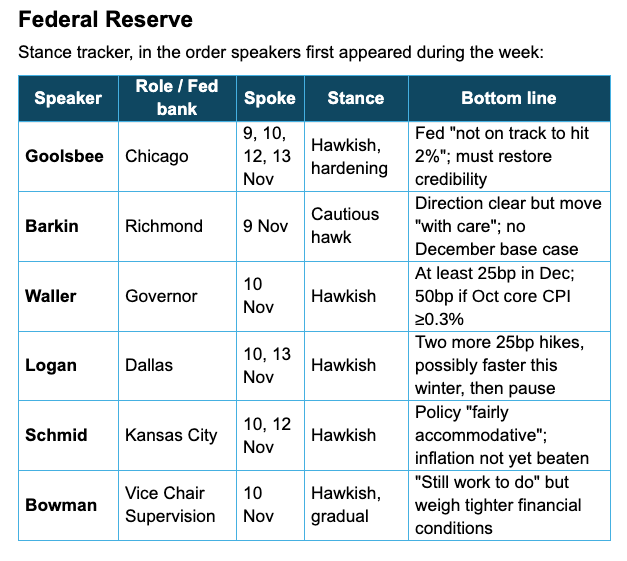
The Fed was almost uniformly hawkish. A December hike is the base case and the debate is pace: Waller floated 50bp if October core CPI ran at 0.3% or higher, Logan wants at least two more 25bp moves, and Collins said the Fed may need to raise more than expected. Goolsbee hardened all week, ending with the Fed "not on track to hit 2%".
The bigger shift is the framing. Goolsbee called data centres "old-fashioned overheating," and Jefferson said the AI build-out makes him wary of aggregate demand. That gives the Fed a reason to tighten into AI capex, so strong AI numbers are no longer unambiguously index-bullish.
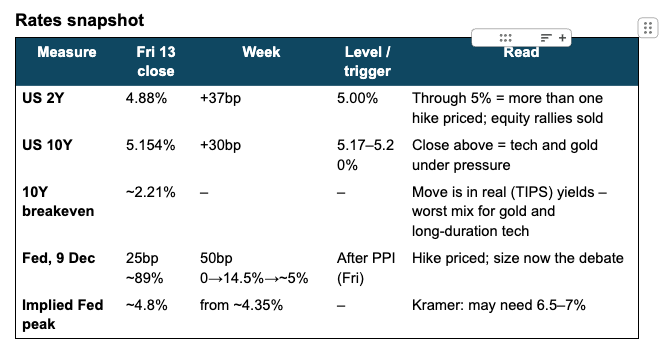
Pricing swung hard. December 50bp odds went from zero to about 14.5% before a cooler PPI pulled them back to 5%. Michael Kramer notes the implied Fed peak jumped from 4.35% to 4.8% in a week, and argues a 1985-2005-style real rate would need 6.5-7%. Yardeni adds that the 10-year rise came through TIPS yields, with breakevens still near 2.21%, the worst mix for gold and long-duration tech.
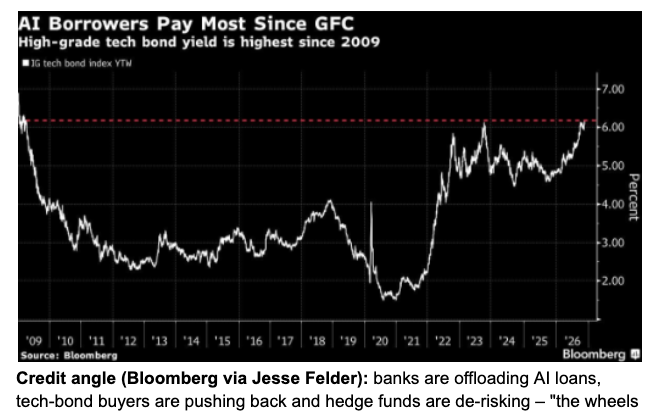
Credit is joining in. Bloomberg, via Jesse Felder, reports banks offloading AI loans and tech-bond buyers pushing back, arguing that the wheels are coming off the AI funding rush. If right, it means wider IG tech spreads and a higher term premium on top of the long-end pressure.
Abroad, the BoE turned hawkish, with Lombardelli open to back-to-back hikes; markets price about 73% for December while economists still expect a hold. The BoJ is split, with Asada dovish and Takata calling for an early hike, while the MoF jawbones as USD/JPY tests 160.
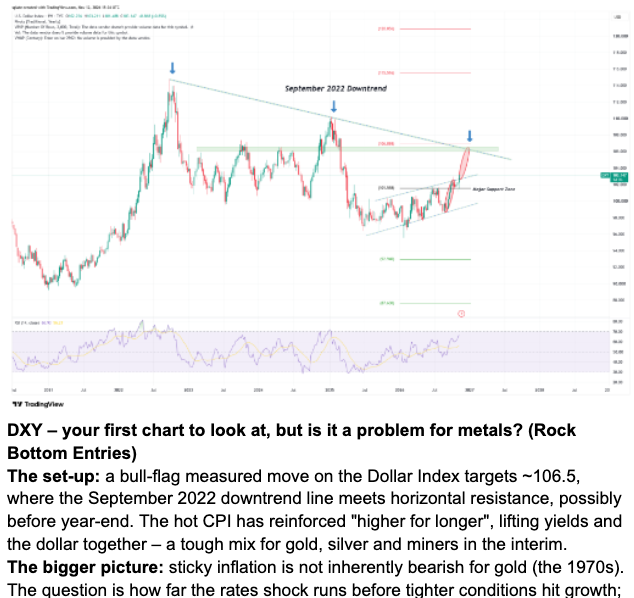
The dollar trade is a 2-year trade. DXY rose 1.09% to 103.41, its highest since April 2025, EUR/USD sits at its lowest since then, and AUD is the weakest G10 currency. Rock Bottom Entries targets about 106.5 on a bull flag. My view: if this is a zig-zag consolidation since January 2026, a 1:1 projection points to failure around 104.80-105, so the dollar top, and the metals low with it, could come sooner and lower.
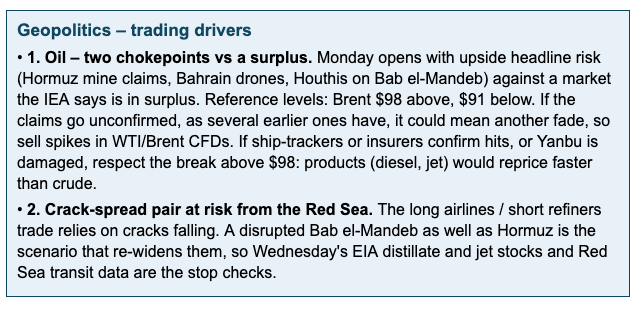
Geopolitics is amplifying volatility rather than setting direction. Iran claims three tankers hit mines in Hormuz and the Houthis took positions on the Bab el-Mandeb coast, yet Brent fell for a second week. APEC brings the first Trump-Xi-Putin trilateral on Thursday, with officials expecting no formal deal.
Technical & Sentiment Breakdown: Supportive, but Increasingly Fragile
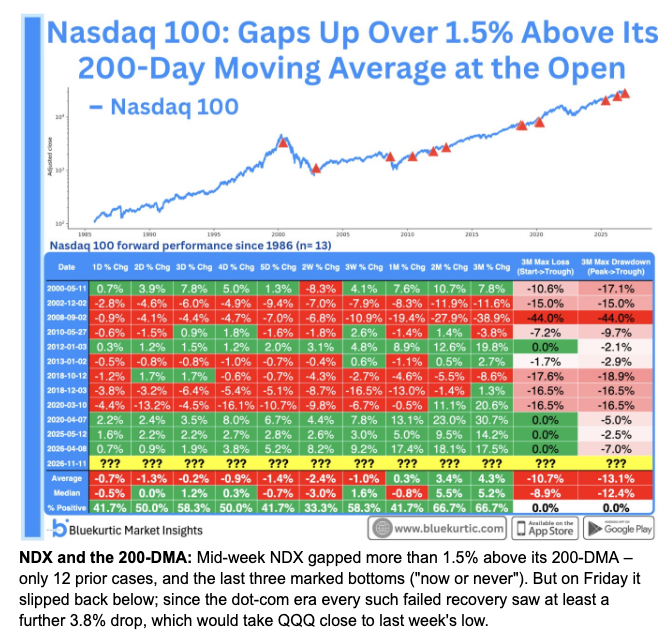
Mid-week, NDX gapped more than 1.5% above its 200-day, which has happened only 12 times before, and the last three marked bottoms. But it slipped back below on Friday. Since the dot-com era, every such failed recovery has seen at least a further 3.8% drop, which points to around 26,880.
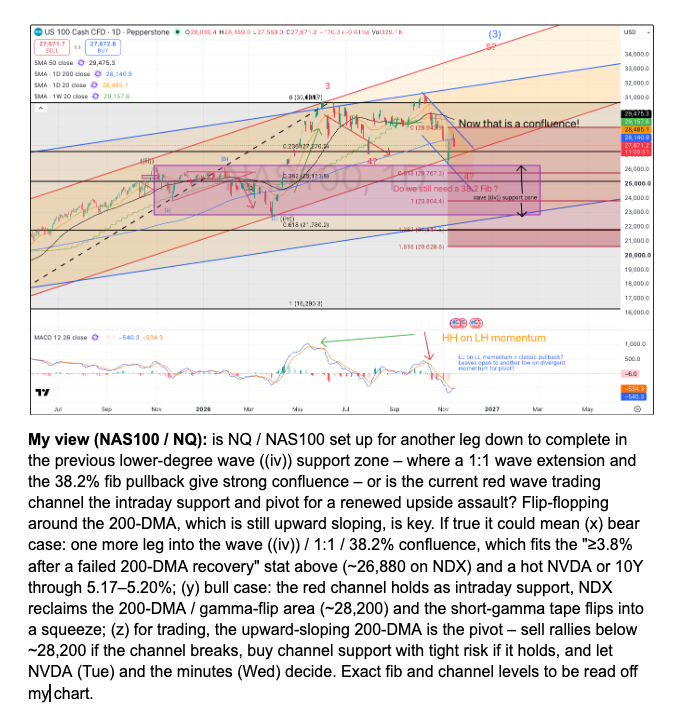
My view on NAS100: Is it set for another leg down into the prior wave ((iv)) zone, where a 1:1 extension and the 38.2% pullback converge, or is the red wave channel the pivot for a renewed upside assault? Flip-flopping around a still-rising 200-day is the key. Sell rallies below the ~28,200 gamma flip if the channel breaks, buy channel support with tight risk if it holds, and let Nvidia and the minutes decide.
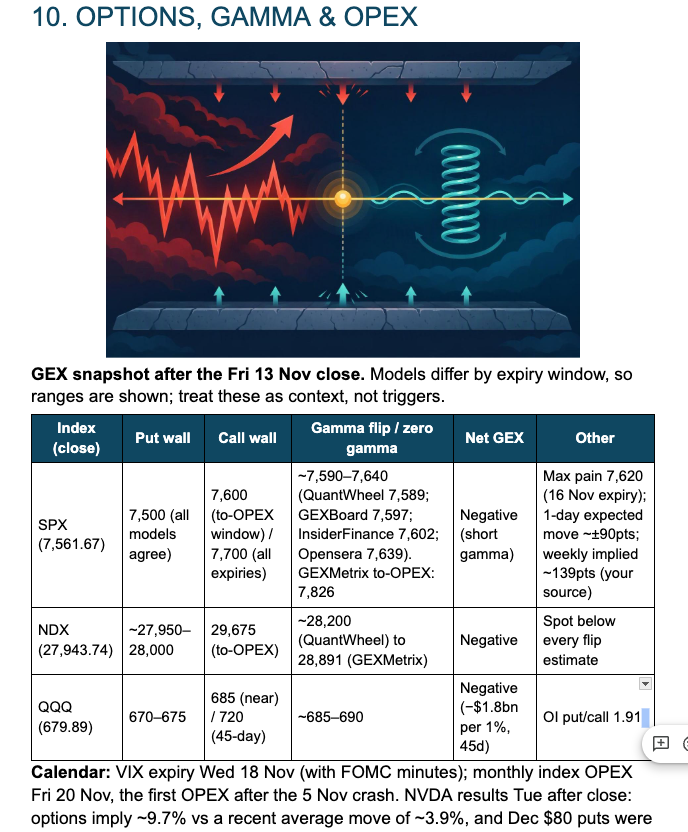
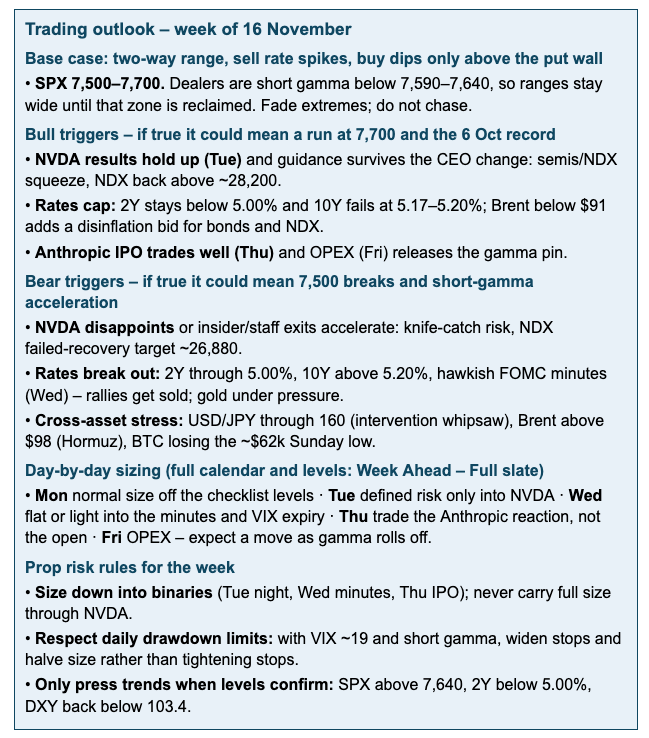
The S&P sits in a short-gamma regime. Every model puts the put wall at 7,500, with call walls at 7,600 and 7,700, and the gamma flip around 7,590-7,640. Below 7,500, dealer hedging accelerates selling into OPEX; a reclaim of 7,640 compresses ranges.
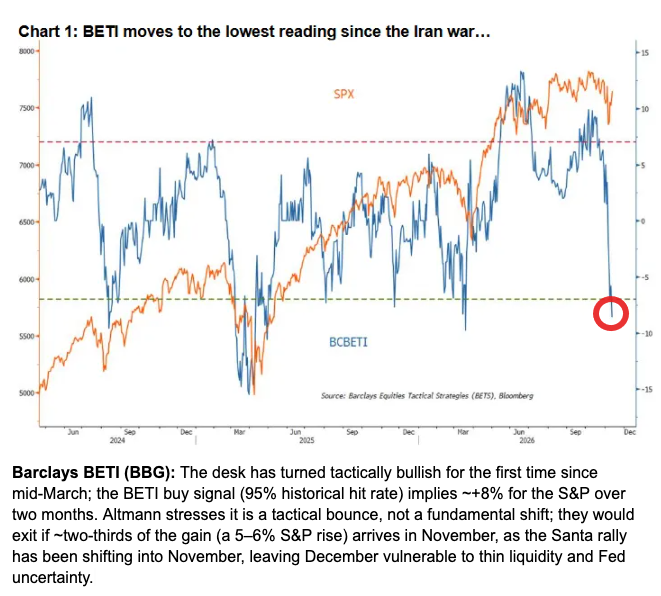
Positioning is supportive. Deutsche Bank's consolidated reading sits at the 26th percentile, AAII bears are above 50%, and Barclays has its first tactical buy signal since March, with a 95% hit rate and roughly +8% over two months. Barclays would exit on a 5-6% November gain, though. Seasonality helps too: the S&P has gained in 27 of the past 31 years around Black Friday.
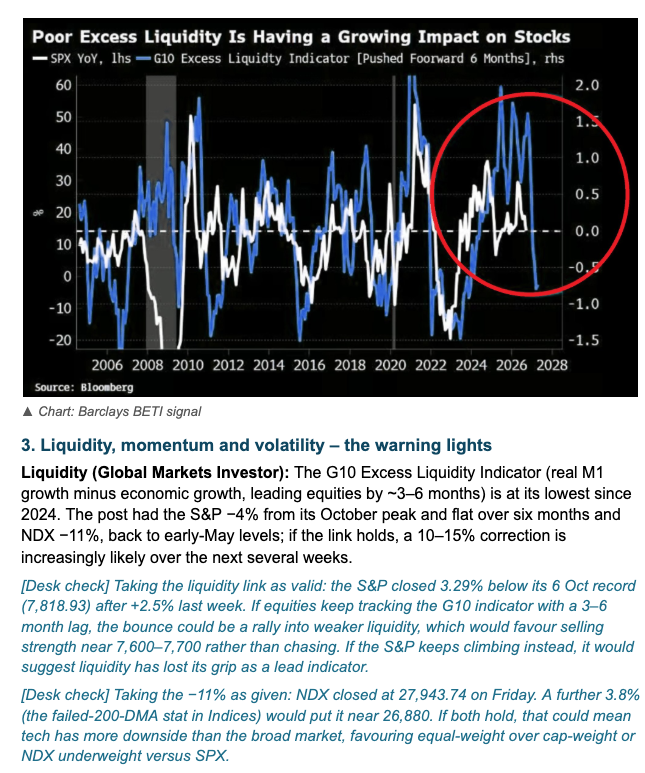
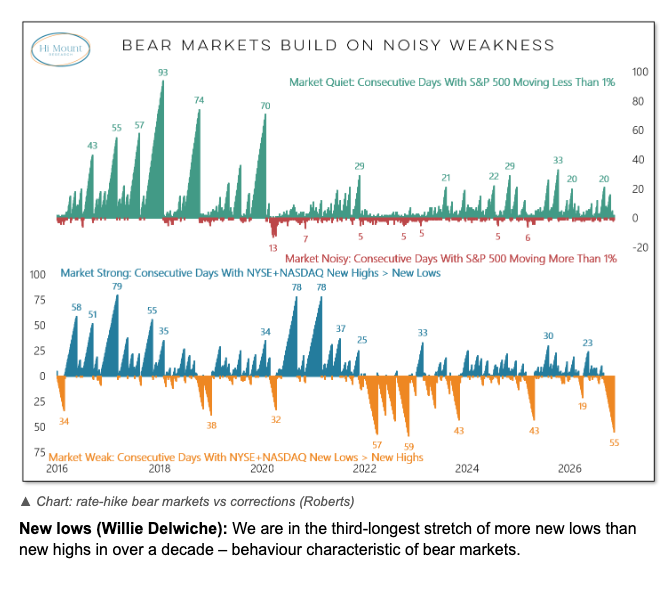
The warning lights are liquidity and breadth. G10 excess liquidity leads equities by three to six months and implies a 10-15% correction risk. After similar four-day jumps, QQQ was higher a month later only 13 of 33 times, and new lows have outnumbered new highs for the third-longest stretch in a decade.
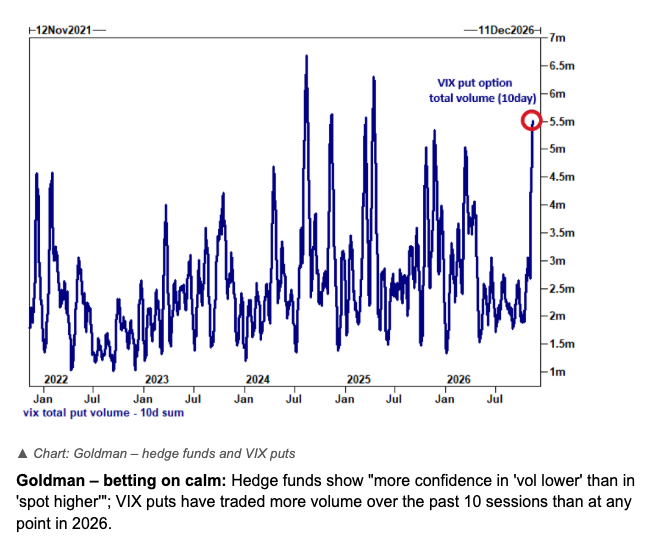
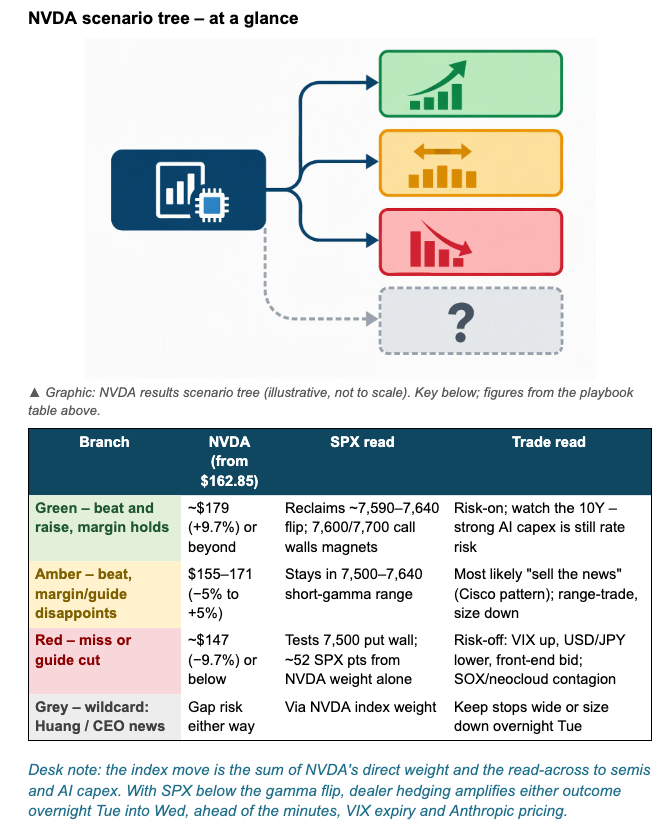
The consensus risk is calm. Goldman sees hedge funds more confident in "vol lower" than "spot higher", with VIX put volume at its highest of 2026. VIX fell from 25.64 to 19.30, while Nvidia options imply a 9.7% move against a 3.9% average. When selling vol into a binary event is consensus, a vol-up surprise becomes the risk.
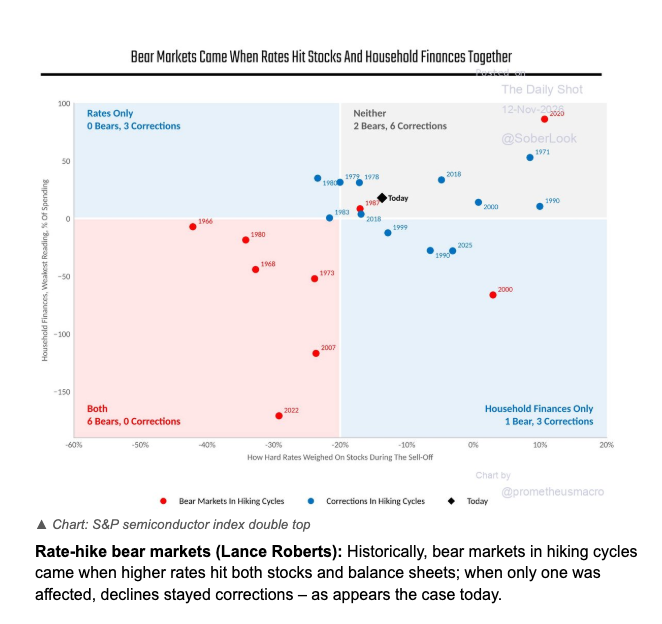
Lance Roberts offers the counterpoint: hiking-cycle bear markets came when higher rates hit both stocks and balance sheets, and today only one is under pressure. My view: recapturing upward-sloping 200-day averages is the key, but that may need some churning through the wall of worry and rate hikes first.
Last Week's Recap: Hot Inflation, Harder Rates and a Rotation That Held
A week where inflation ran hot, the Fed leaned harder, and the index rallied anyway on rotation. Gold lost its haven bid, crypto lost its flows, and oil kept shedding premium despite the headlines.
Key Highlights
Macro: October CPI rose 0.4% against 0.3% expected, with core at 0.3%, while PPI cooled to 0.3% and gasoline slipped below $4 for the first time since August. The KL notes CPI is up 30.2% since January 2020, 15.9 points above a 2% path, and has sat above target for 67 straight months. Peter Schiff sees falling home sales as a prelude to a price crash. I'm not convinced: a crash probably needs forced sellers in the fixed-rate mortgage market first.
China: China is exporting goods inflation while home demand stays weak. October PPI hit 5.7%, the highest since June 2022, against CPI of just 0.7%. Monday's activity data then missed across the board, with industrial production at 4.8%, retail sales at 0.4% and fixed investment down 8.1% year to date. Xi goes into APEC weaker on the domestic front, with the trade truce running to 10 January.
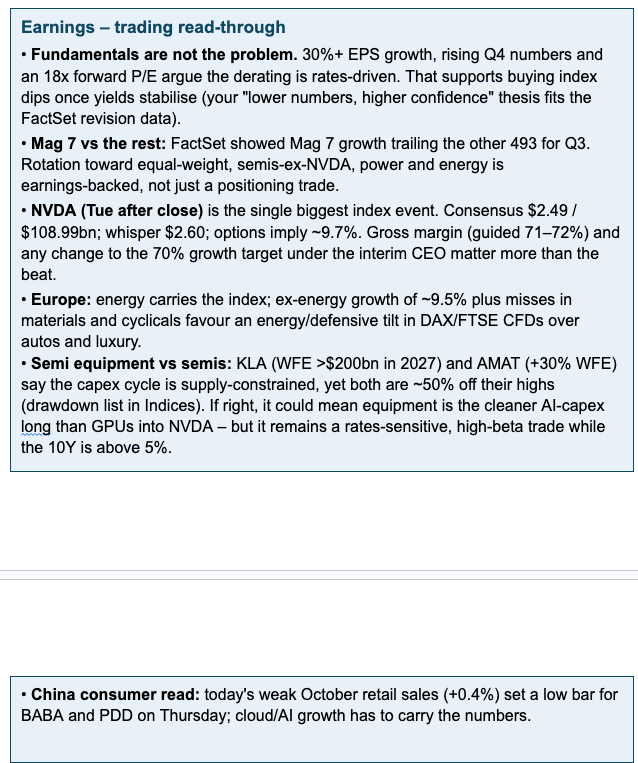
Earnings: Fundamentals are not the problem. With 91% reported, 84% beat on EPS and blended growth reached 31.9%. The forward P/E of 18.3 suggests the derating is rates-driven. AI hardware showed "sell the news" risk, with Cisco falling on slower orders and Nebius dropping 9.9%, while AI power names like Constellation and Venture Global were rewarded. Lower numbers held with more confidence can walk the multiple back up, and against the wall of worry another up-leg is likely.
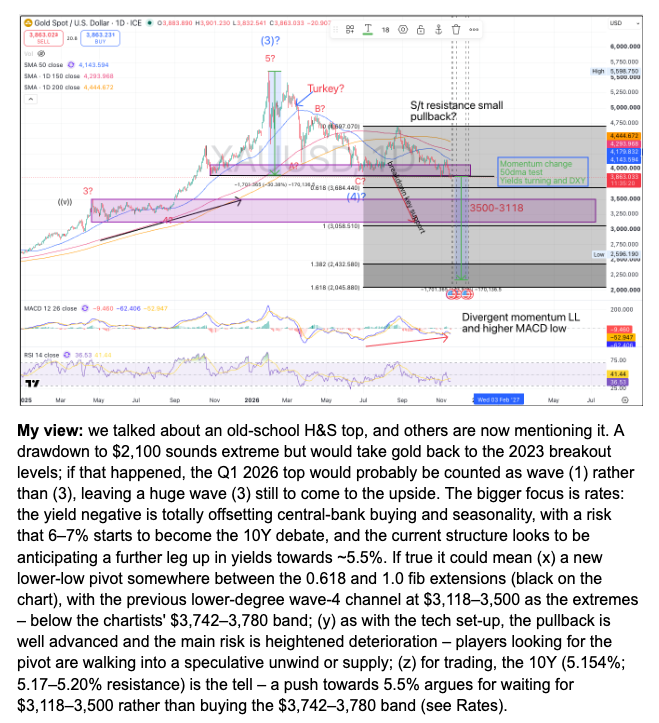
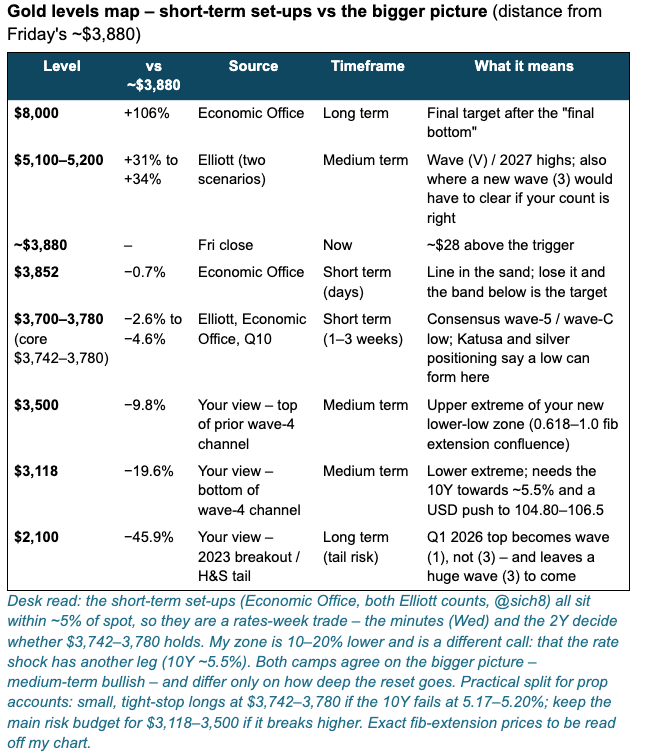
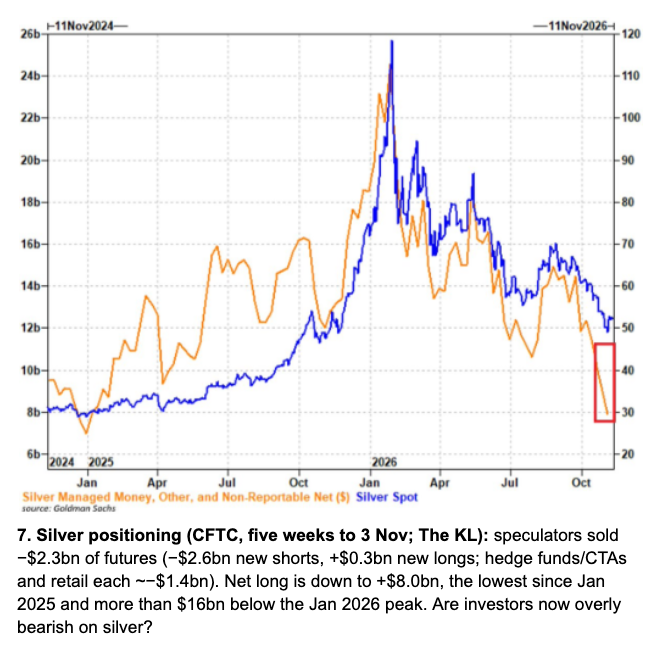
Commodities: Gold fell about 4.6% to $3,880 in an escalation week, so it is trading real yields, not headlines. Most chartists are short-term bearish and medium-term bullish, with $3,852 the trigger and $3,742-3,780 the support band. My view: the yield negative is offsetting central-bank buying and seasonality, and a 10-year push towards 5.5% risks a deeper low at $3,118-3,500. A $2,100 tail would revisit the 2023 breakout and leave a huge wave (3) still to come. Silver speculators have cut net longs to $8.0bn, the lowest since January 2025.
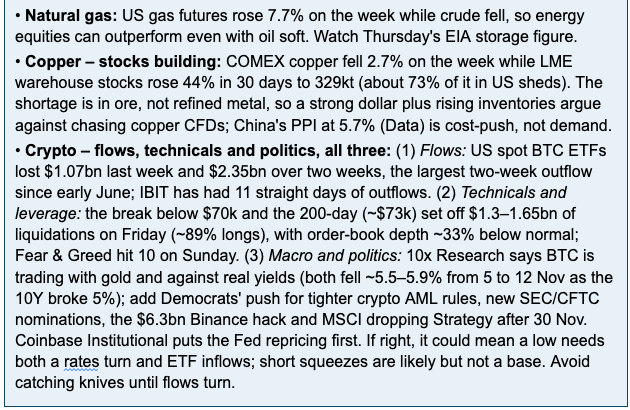
Crypto: Bitcoin fell below $70k on Friday for the first time since August and hit about $62.1k on Sunday before recovering above $65k. Spot ETFs lost $2.35bn over two weeks, liquidations reached $1.3-1.65bn, and Fear & Greed fell to 10. A low needs both a rates turn and ETF inflows.
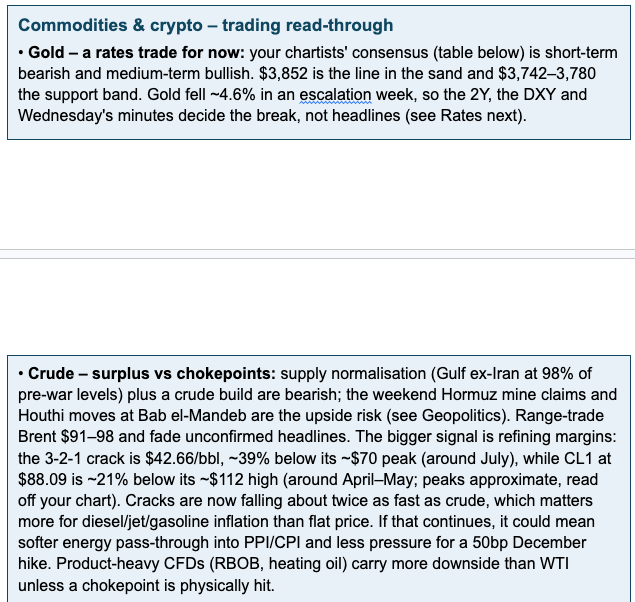
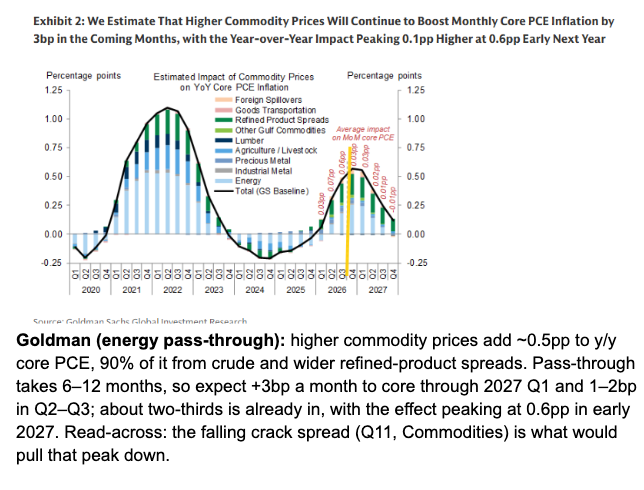
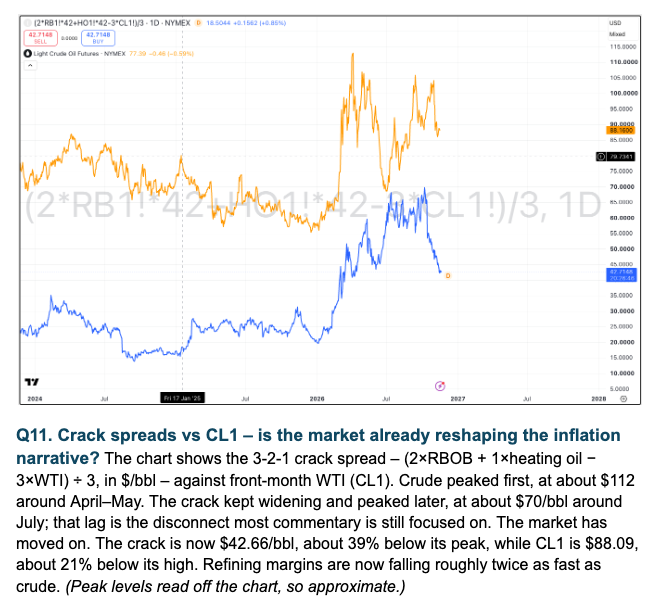
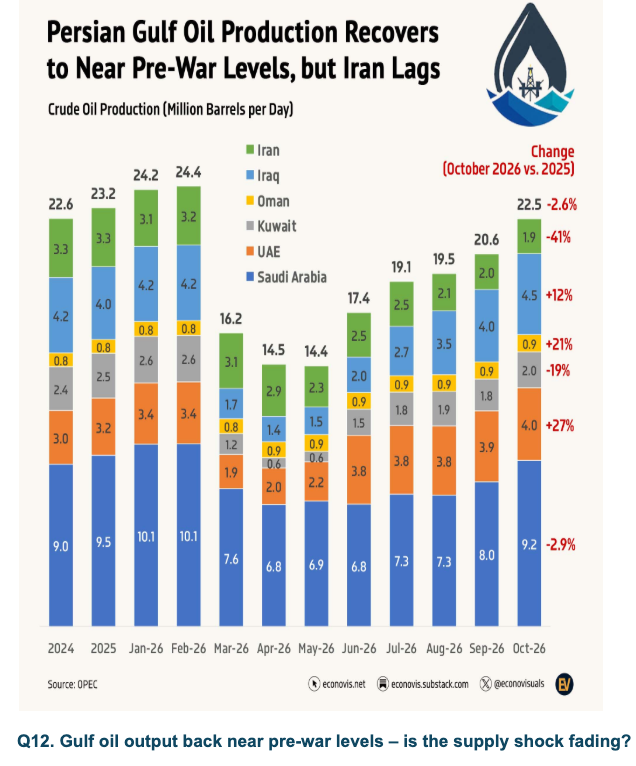
Oil: Brent fell 2.5% to $95.84, its second weekly drop, and WTI is 17% off its September high. Gulf output ex-Iran is back at 98% of pre-war levels. The bigger signal is refining: the 3-2-1 crack is $42.66, about 39% below its peak, while crude is down only 21%. Cracks falling twice as fast as crude means less diesel and jet-fuel pressure feeding into PPI and CPI.
The Week Ahead: Key Data and Market-Moving Signals
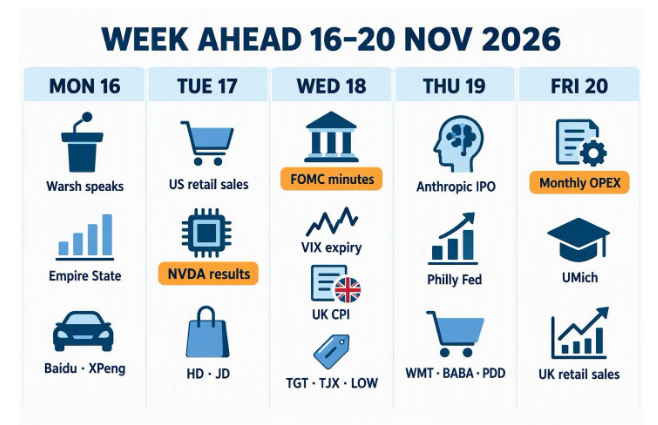
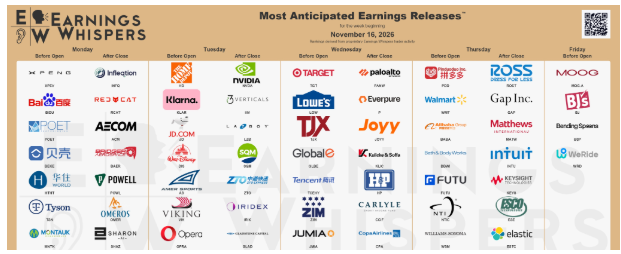
A week when the rotation has to survive the AI referendum. Nvidia reports Tuesday after the close, with consensus at $2.49 on $108.99bn against a $2.60 whisper and options implying 9.7%; gross margin, guided down to 71-72% on memory costs, matters more than the beat. Anthropic prices Wednesday and trades Thursday, alongside Trump-Xi at APEC, before Friday's monthly OPEX.
Monday, November 16
- China: October Activity Data (IP, Retail Sales, FAI)
- Japan: Q3 GDP
- Global: Trump at ASEAN Summit, Manila
- China: Baidu & XPeng Earnings
- US: Empire State Manufacturing
- Canada: CPI (Oct)
- US: Fed Chair Warsh Opening Remarks, Productivity & Jobs Task Force
- US: Fed Williams Opening Remarks, NY Fed FX Conference
- US: Fed Barr Speech on AI & Financial Stability, Milan
- Japan: BoJ Tamura Speech
Tuesday, November 17
- Australia: RBA Minutes
- UK: Labour Market Data
- Germany: ZEW Sentiment
- Middle East: Iran FM Araqchi in Oman
- UK: 2041 Gilt Auction
- US: Home Depot, JD.com & Disney Earnings
- US: Retail Sales & Import Prices (Oct)
- US: Industrial Production & NAHB Housing Index
- US: Fed Waller, Musalem & Hammack Speeches
- US: Fed Williams Fireside Chat
- US: NVIDIA Earnings
Wednesday, November 18
- UK: CPI (Oct)
- Eurozone: Final CPI (Oct)
- Global: APEC Leaders' Meeting Opens, Shenzhen
- Japan: 20-Year JGB Auction
- US: Target, TJX & Lowe's Earnings
- US: Housing Starts & Building Permits
- US: EIA Petroleum Status (Crude, Distillate & Jet Fuel)
- US: 20-Year Bond Auction
- US: FOMC Minutes & VIX Expiry
- US: Fed Williams, Barr & Kashkari Speeches
- US: Anthropic IPO Pricing
- US: Palo Alto Networks Earnings
Thursday, November 19
- Japan: CPI (Oct)
- Australia: Employment (Oct)
- China: Alibaba, PDD & NetEase Earnings
- US: Walmart Earnings
- Global: APEC, Trump-Xi Bilateral & Trump-Xi-Putin Trilateral
- US: Philly Fed, Jobless Claims & Leading Indicators
- US: Anthropic (ANT) First Trade
- US: 10-Year TIPS Auction
- US: Fed Jefferson, Barr, Goolsbee & Hammack Speeches
- US: Intuit, Ross Stores & Keysight Earnings
- US: Fed Paulson Speech, Money Marketeers
Friday, November 20
- UK: Retail Sales (Oct)
- US: BJ's Wholesale Earnings
- Canada: Retail Sales
- US: UMich Sentiment (Final Nov)
- US: Monthly Index & Equity OPEX
- US: Fed Cook Speech, Central Bank of Chile
- US: Fed Waller Speech, College Fed Challenge
Alpha Takeaway: Rotation Has Fuel, but Rates Still Have the Final Say
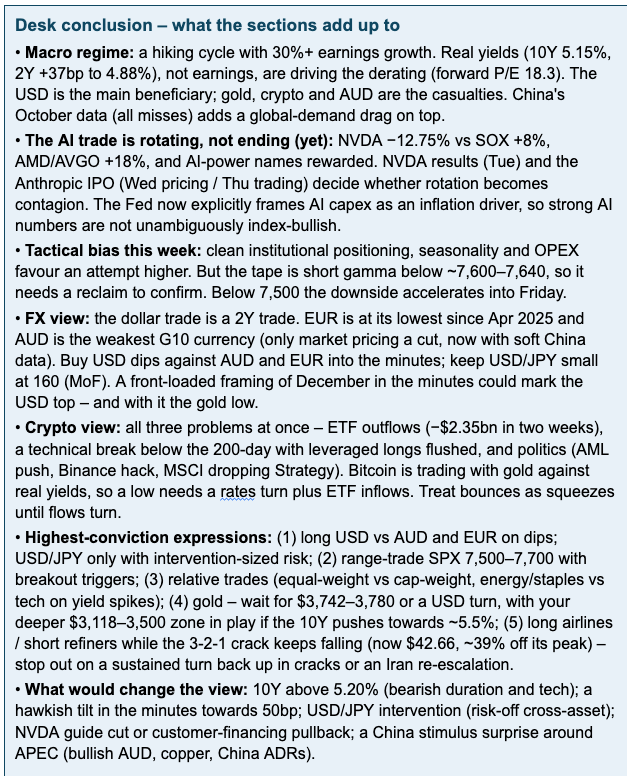
This looks like rotation inside the AI trade, not yet a fresh up-leg. Clean institutional positioning, seasonality, and OPEX can fuel an attempt higher, but a short-gamma tape and rising real yields can make another fall sharper.
Equities: The 7,500 put wall and the 7,590-7,640 gamma flip frame the first test for the S&P. Reclaiming 7,640 and holding it would compress ranges and bring the 7,700 call wall into play, while a break of 7,500 accelerates into Friday's OPEX. For NDX, ~28,200 separates a reversed breakdown from the ~26,880 failed-recovery target. Nvidia on Tuesday is the first test, then the minutes, Anthropic, and OPEX.
Gold & Silver: Gold needs to hold its $3,852 trigger. Losing it opens the $3,742-3,780 band, and a 10-year push towards 5.5% puts $3,118-3,500 in play. Silver's speculative net long at $8.0bn says positioning is clearing, which is what a medium-term low needs.
Crypto: Treat Bitcoin's slide below $70k as a flows problem, not just a price one. ETF outflows, a break of the 200-day, and political headwinds all hit at once. Until a rates turn meets ETF inflows, bounces are squeezes, not a base.
Macro: The benign outcome is minutes that frame a bigger December move as front-loading before a pause, which could mark the dollar top and the gold low together. The less comfortable one is a longer cycle that takes the 2-year through 5%. Watch the 20-year auction, the 10-year TIPS sale and Wednesday's EIA distillate stocks separately, and remember that falling refining margins matter more for inflation than the crude price.
A strong rally can still be a squeeze until the S&P reclaims its gamma flip and NDX its 200-day. The bottom line: Nvidia holding up, a 2-year below 5% and a reclaim of 7,640 would argue for a run at the October record, while a guide cut, a 10-year above 5.20% and a break of 7,500 would argue the other way. Trust levels that confirm more than a cheap valuation, and earnings confidence more than an oversold label. Stay tactically long-biased with tight risk, but strategically cautious until the 10-year turns lower, and size down into every binary.
Charts and figures are from the 16 November 2026 weekly pack. This is a recap of that tape. It is not a personal recommendation, and nothing in it is guaranteed.