Identifying trend reversals in financial markets is a crucial skill for traders and investors. Recognizing when a trend is losing momentum can present opportunities for profitable trades or help avoid potential losses. Here are some common methods and indicators, supported by statistics, to help you spot potential trend reversals.
Price Patterns
Head and Shoulders
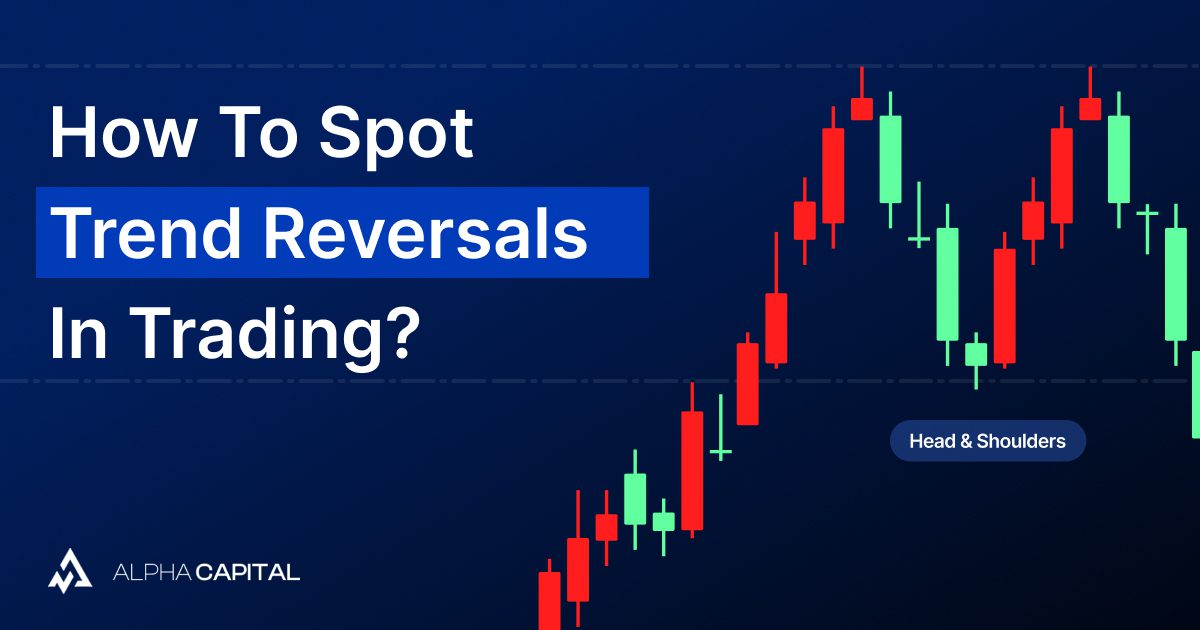
The head and shoulders pattern is a classic reversal signal. It consists of three peaks: a higher high (the head) flanked by two lower highs (the shoulders). According to Thomas Bulkowski’s Encyclopedia of Chart Patterns, the head and shoulders pattern has a success rate of approximately 83% in predicting trend reversals when confirmed by a break of the neckline.
Double Top and Double Bottom
These patterns occur when the price tests a resistance level twice (double top) or a support level twice (double bottom) without breaking through. Bulkowski’s research indicates that double tops and bottoms have a success rate of about 65% in signaling reversals.
Triple Top and Triple Bottom
Similar to double tops and bottoms, triple tops and bottoms involve three tests at a particular level, suggesting even stronger reversal signals.
Moving Averages
Moving averages are useful for spotting changes in trend direction. A simple strategy is to observe the crossover of shorter-term moving averages (e.g., 50-day) with longer-term ones (e.g., 200-day). Historical data from various market studies shows that the “Golden Cross” (bullish crossover) and “Death Cross” (bearish crossover) can be effective indicators, with success rates varying based on market conditions but often exceeding 60%.
Relative Strength Index (RSI)
The RSI is a momentum oscillator that measures the speed and change of price movements. When RSI reaches overbought (above 70) or oversold (below 30) levels and then reverses, it can indicate a potential trend reversal.
Divergence
Divergence occurs when price movement and an indicator (like RSI or MACD) move in opposite directions. Bullish divergence happens when the price makes lower lows, but the indicator makes higher lows. Bearish divergence is the opposite.
Candlestick Patterns
Certain candlestick patterns, such as engulfing patterns, doji, and hammers, can signal reversals, especially when they appear near support or resistance levels. Research by Steve Nison, a pioneer in candlestick charting, indicates that these patterns can have success rates ranging from 50% to 70%, depending on the market context and confirmation by other signals.
Volume Analysis
An increase in trading volume during a price reversal can confirm the strength of the new trend. A substantial volume increase during a reversal may indicate a valid trend change, with studies showing that volume spikes can enhance the reliability of reversal signals by up to 20%.
Trendline Breaks
Drawing trendlines connecting the lows or highs in an existing trend can help identify reversals. A break of these trendlines can be a sign of a trend reversal.