Weekly Market Outlook: April 28, 2025

Markets enter a pivotal week balancing AI-fueled optimism against tariff risks, shaky breadth, and major macro data, with traders watching whether this rally can hold or needs one more reset.

Leaking Glass, MAG7 Power & Tariff Jitters

Key Market Themes: A Geopolitical Tightrope and MAG7 Mania

Trump’s central bank poking, China’s trade flip-flops, and Russia’s staged posturing made for a loud macro week. Yet through it all, the US markets cling to safe-haven status.

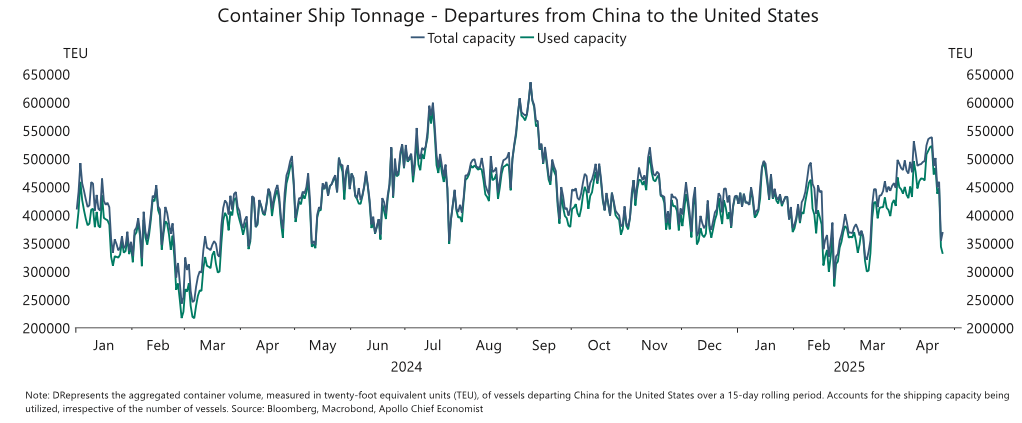
  • US-China trade shows deceleration
Chart showing container ship tonnage from China to the United States falling sharply in April 2025, with both total and used shipping capacity dropping after months of relatively stable but volatile volumes.
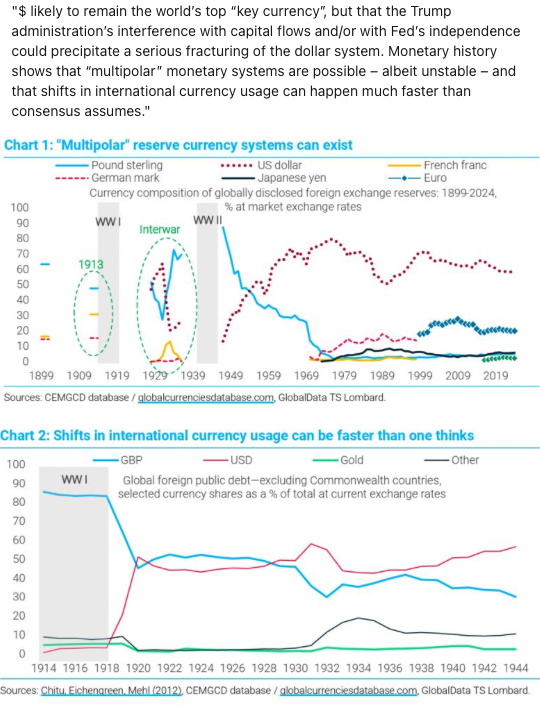
  • Dollar trust erosion fears grow
Two charts illustrate that multipolar reserve currency systems have existed historically and that shifts in global currency usage can happen rapidly, supporting concerns about potential long-term changes to dollar dominance.

De-dollarisation risks loom, but liquidity remains positive in the short run. Meanwhile, MAG7 earnings juggernauts look ready to unleash another AI-fueled rally.

Technical & Sentiment Analysis: Is This Rally for Real?

The SPX has rebounded fiercely from the post-Liberation Day crash, but critical technical crossroads are here:

SPX Decision Point
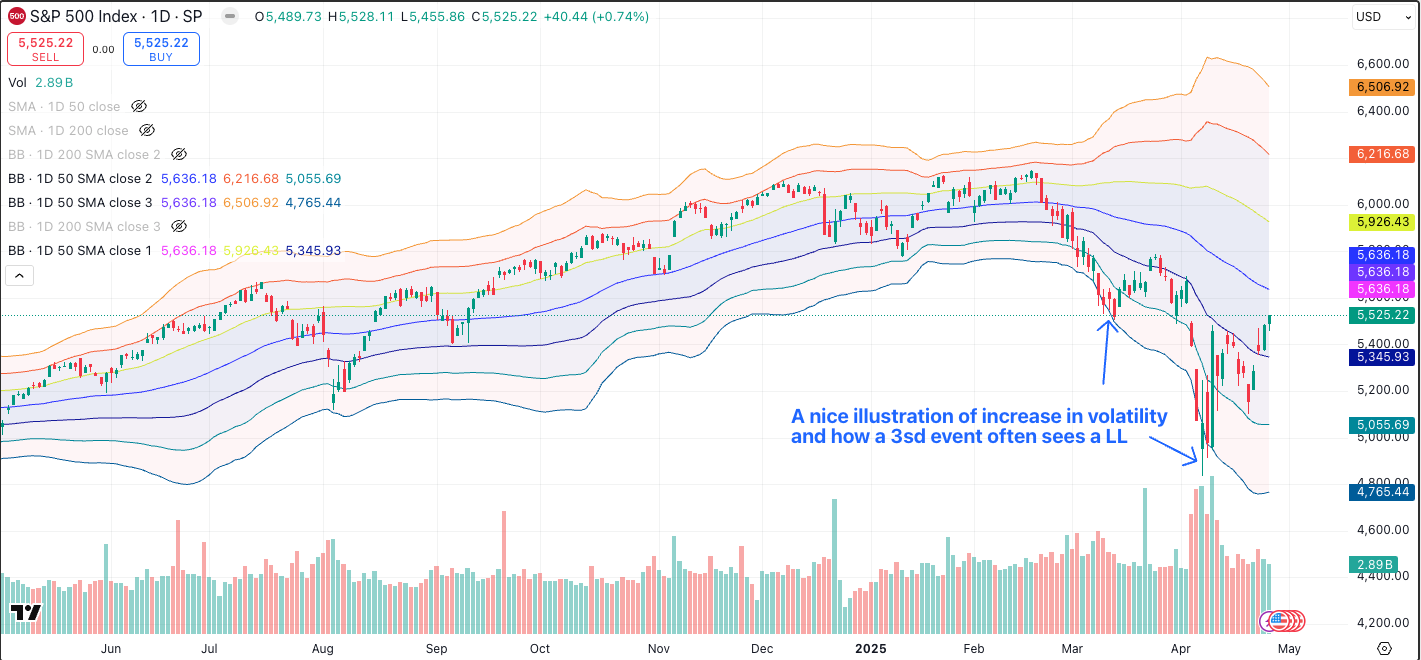
S&P 500 daily chart showing a rebound after a sharp volatility-driven selloff, highlighting a third downside event forming a lower low before recovery within widening Bollinger Bands.
  • Hovering at the 50% Fib retracement

Breadth
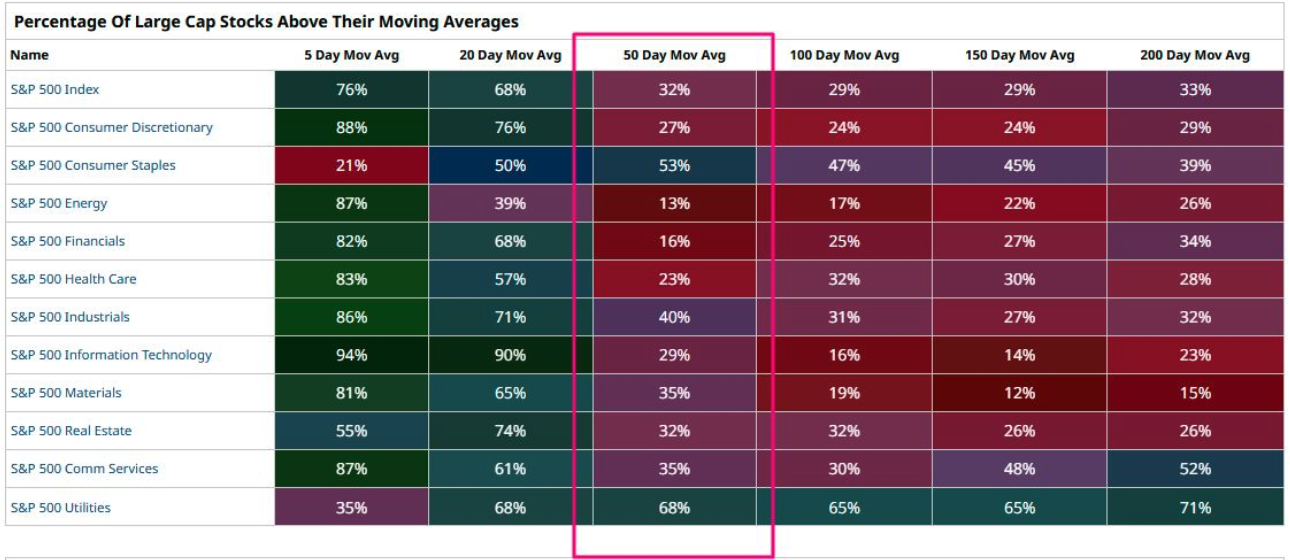
Heatmap table showing a sharp drop in the percentage of S&P 500 large-cap stocks trading above their 50-, 100-, and 150-day moving averages, signaling weak underlying market breadth despite short-term strength.
  • Breadth shallow: Despite strong price action, underlying breadth remains suspect

Volatility
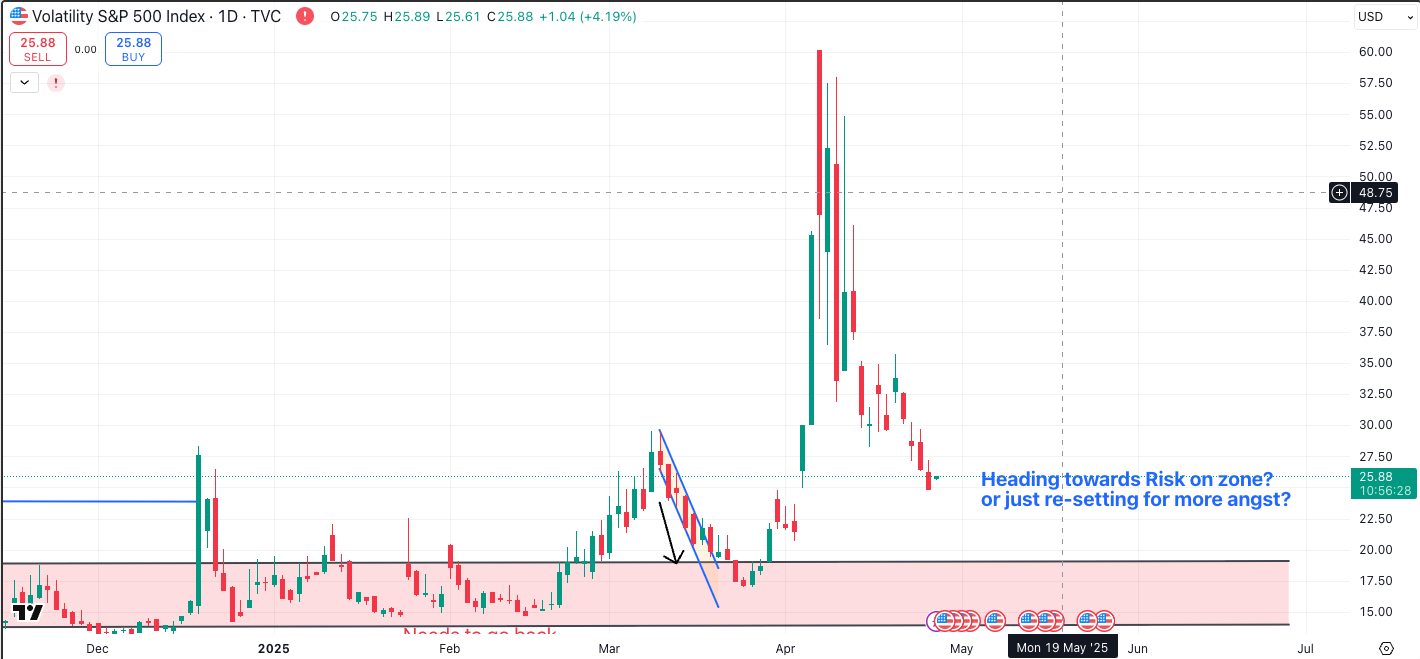
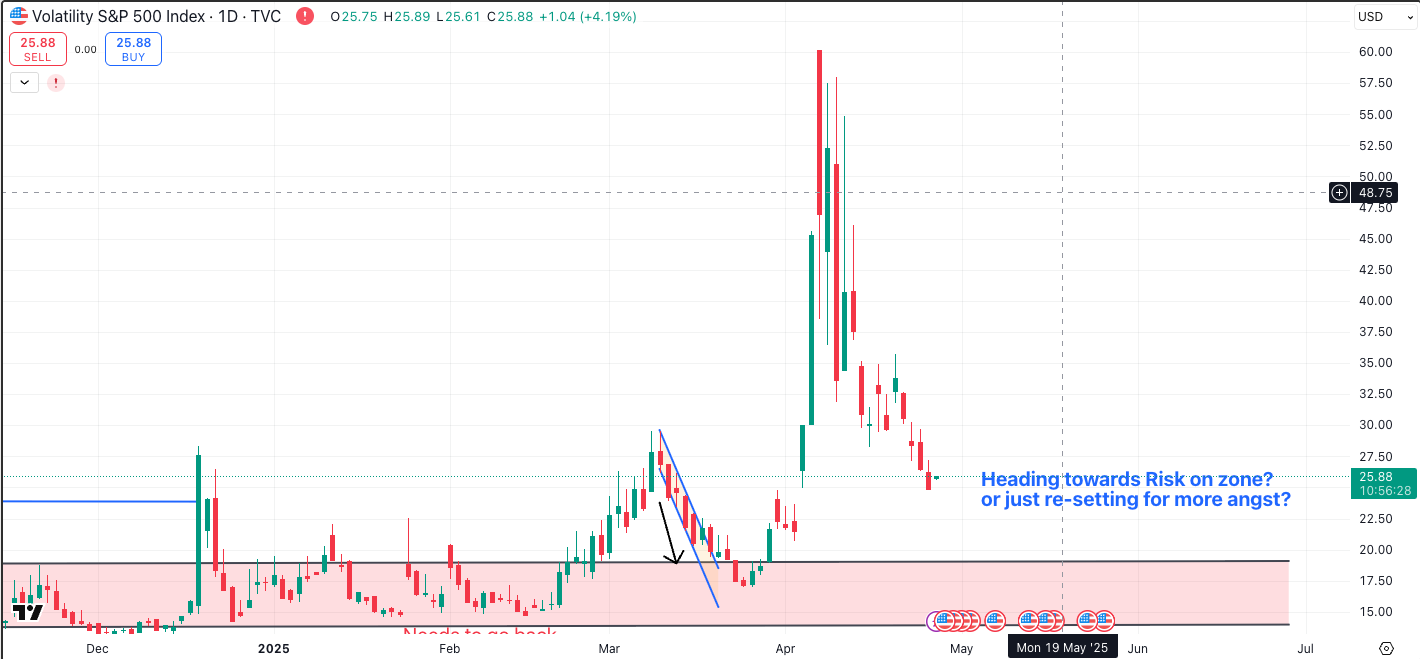
VIX daily chart shows volatility pulling back sharply from recent spike highs toward a lower “risk-on” zone, while questioning whether markets are stabilizing or merely resetting for another volatility surge.
  • VIX is cooling but not yet comfortably low
  • VVIX calming signals volatility premium fading
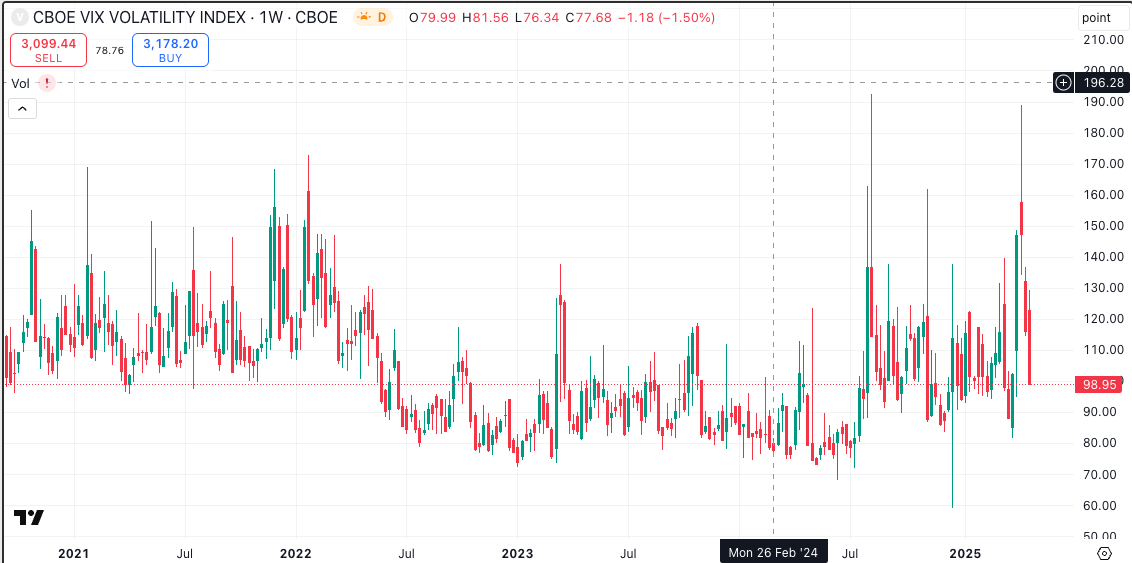
Weekly VIX chart shows volatility remaining elevated within a historically active range, with repeated spikes near extreme levels signaling persistent macro and market stress.

Positioning & Sentiment

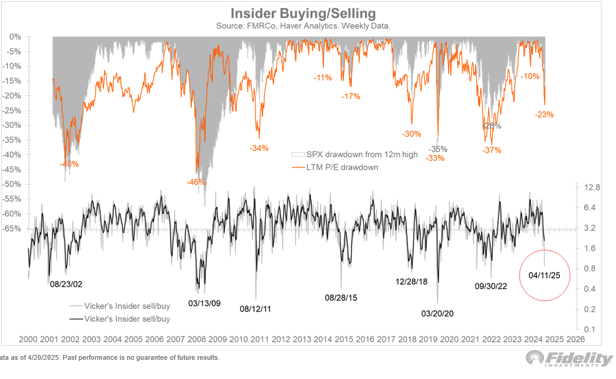
Fidelity chart of insider buying versus selling shows corporate insiders increasing purchases near recent market drawdowns, suggesting contrarian bullish signals at current levels.
  • Retail sour, insiders buying

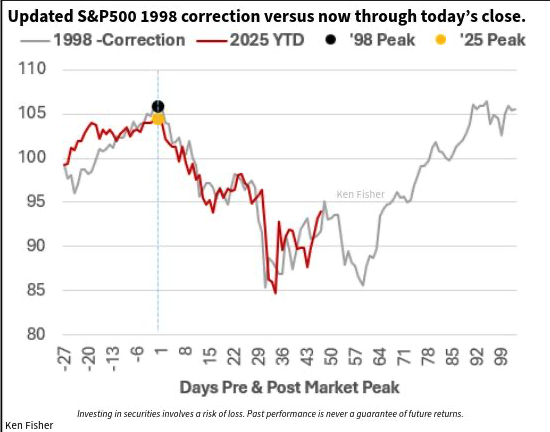
Historical echoes from 1998 remain strong but suggest a re-test of lows before the breakout:

  • Ken Fisher's 1998 analogy
Comparison chart overlays the 1998 S&P 500 correction with 2025 price action, showing a similar drawdown pattern and suggesting potential for a retest before a stronger recovery.
  • Jurrien Timmer's breakdown retest thesis
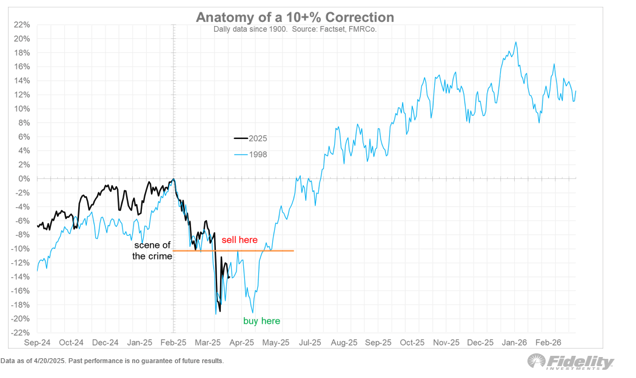
Chart comparing the 2025 pullback to the 1998 correction highlights a similar 10% correction structure, implying current weakness may resemble a shakeout before a potential rebound.

Pain Trade

Upwards as even the bulls see a pullback.

Short-Term Risk

Choppy pullback before real upside.

Last Week’s Recap: Wall Street Roars as Tariffs Bite Main Street

Big beats from AI-powered companies saved the week:

  • ServiceNow soared 16%, Alphabet cloud metrics shone.
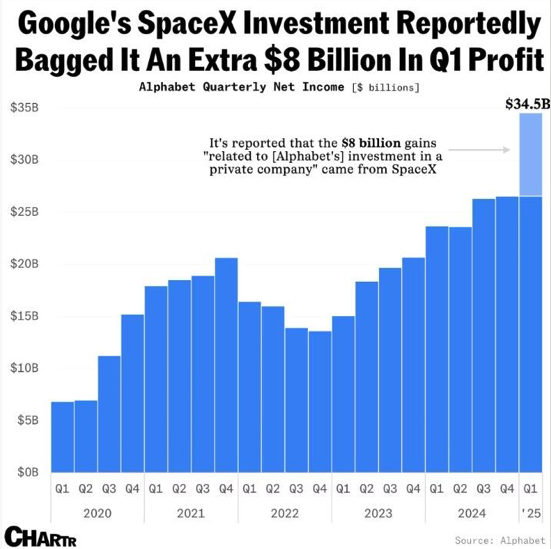
Bar chart shows Alphabet’s quarterly net income hitting a record $34.5 billion in Q1 2025, boosted in part by an estimated $8 billion gain tied to its SpaceX investment.
  • Tesla rebounded, despite weak margins.
  • Durable Goods headline strong, core soft.
  • Zweig Breadth thrust trigger confirmed.

Fund Flows

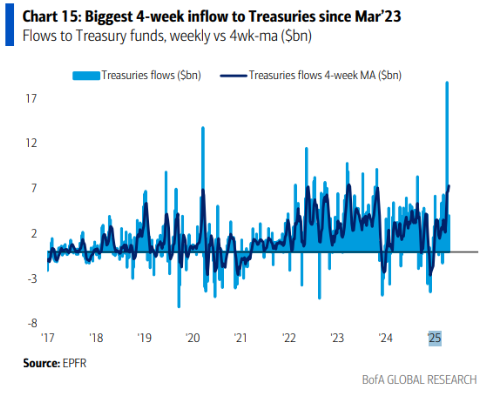
  • Massive Treasury inflows
BofA chart shows the largest four-week inflow into Treasury funds since March 2023, signaling a strong recent shift toward defensive positioning in bonds.
  • Crypto mania reignited.
  • UK retail defied miserable consumer sentiment
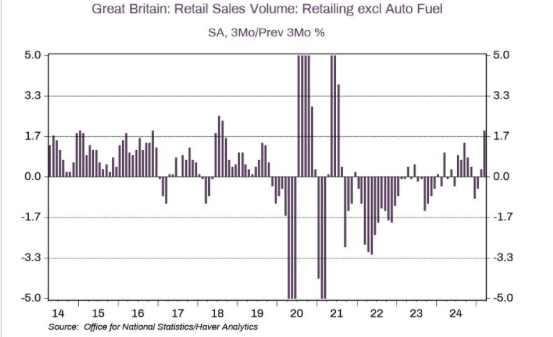
UK retail sales volume chart shows consumer spending recovering modestly after sharp swings in recent years, with recent readings pointing to resilient but uneven demand.

Upcoming Week Ahead: Data Tsunami Incoming

Hold your breath: it's a mega-week ahead.
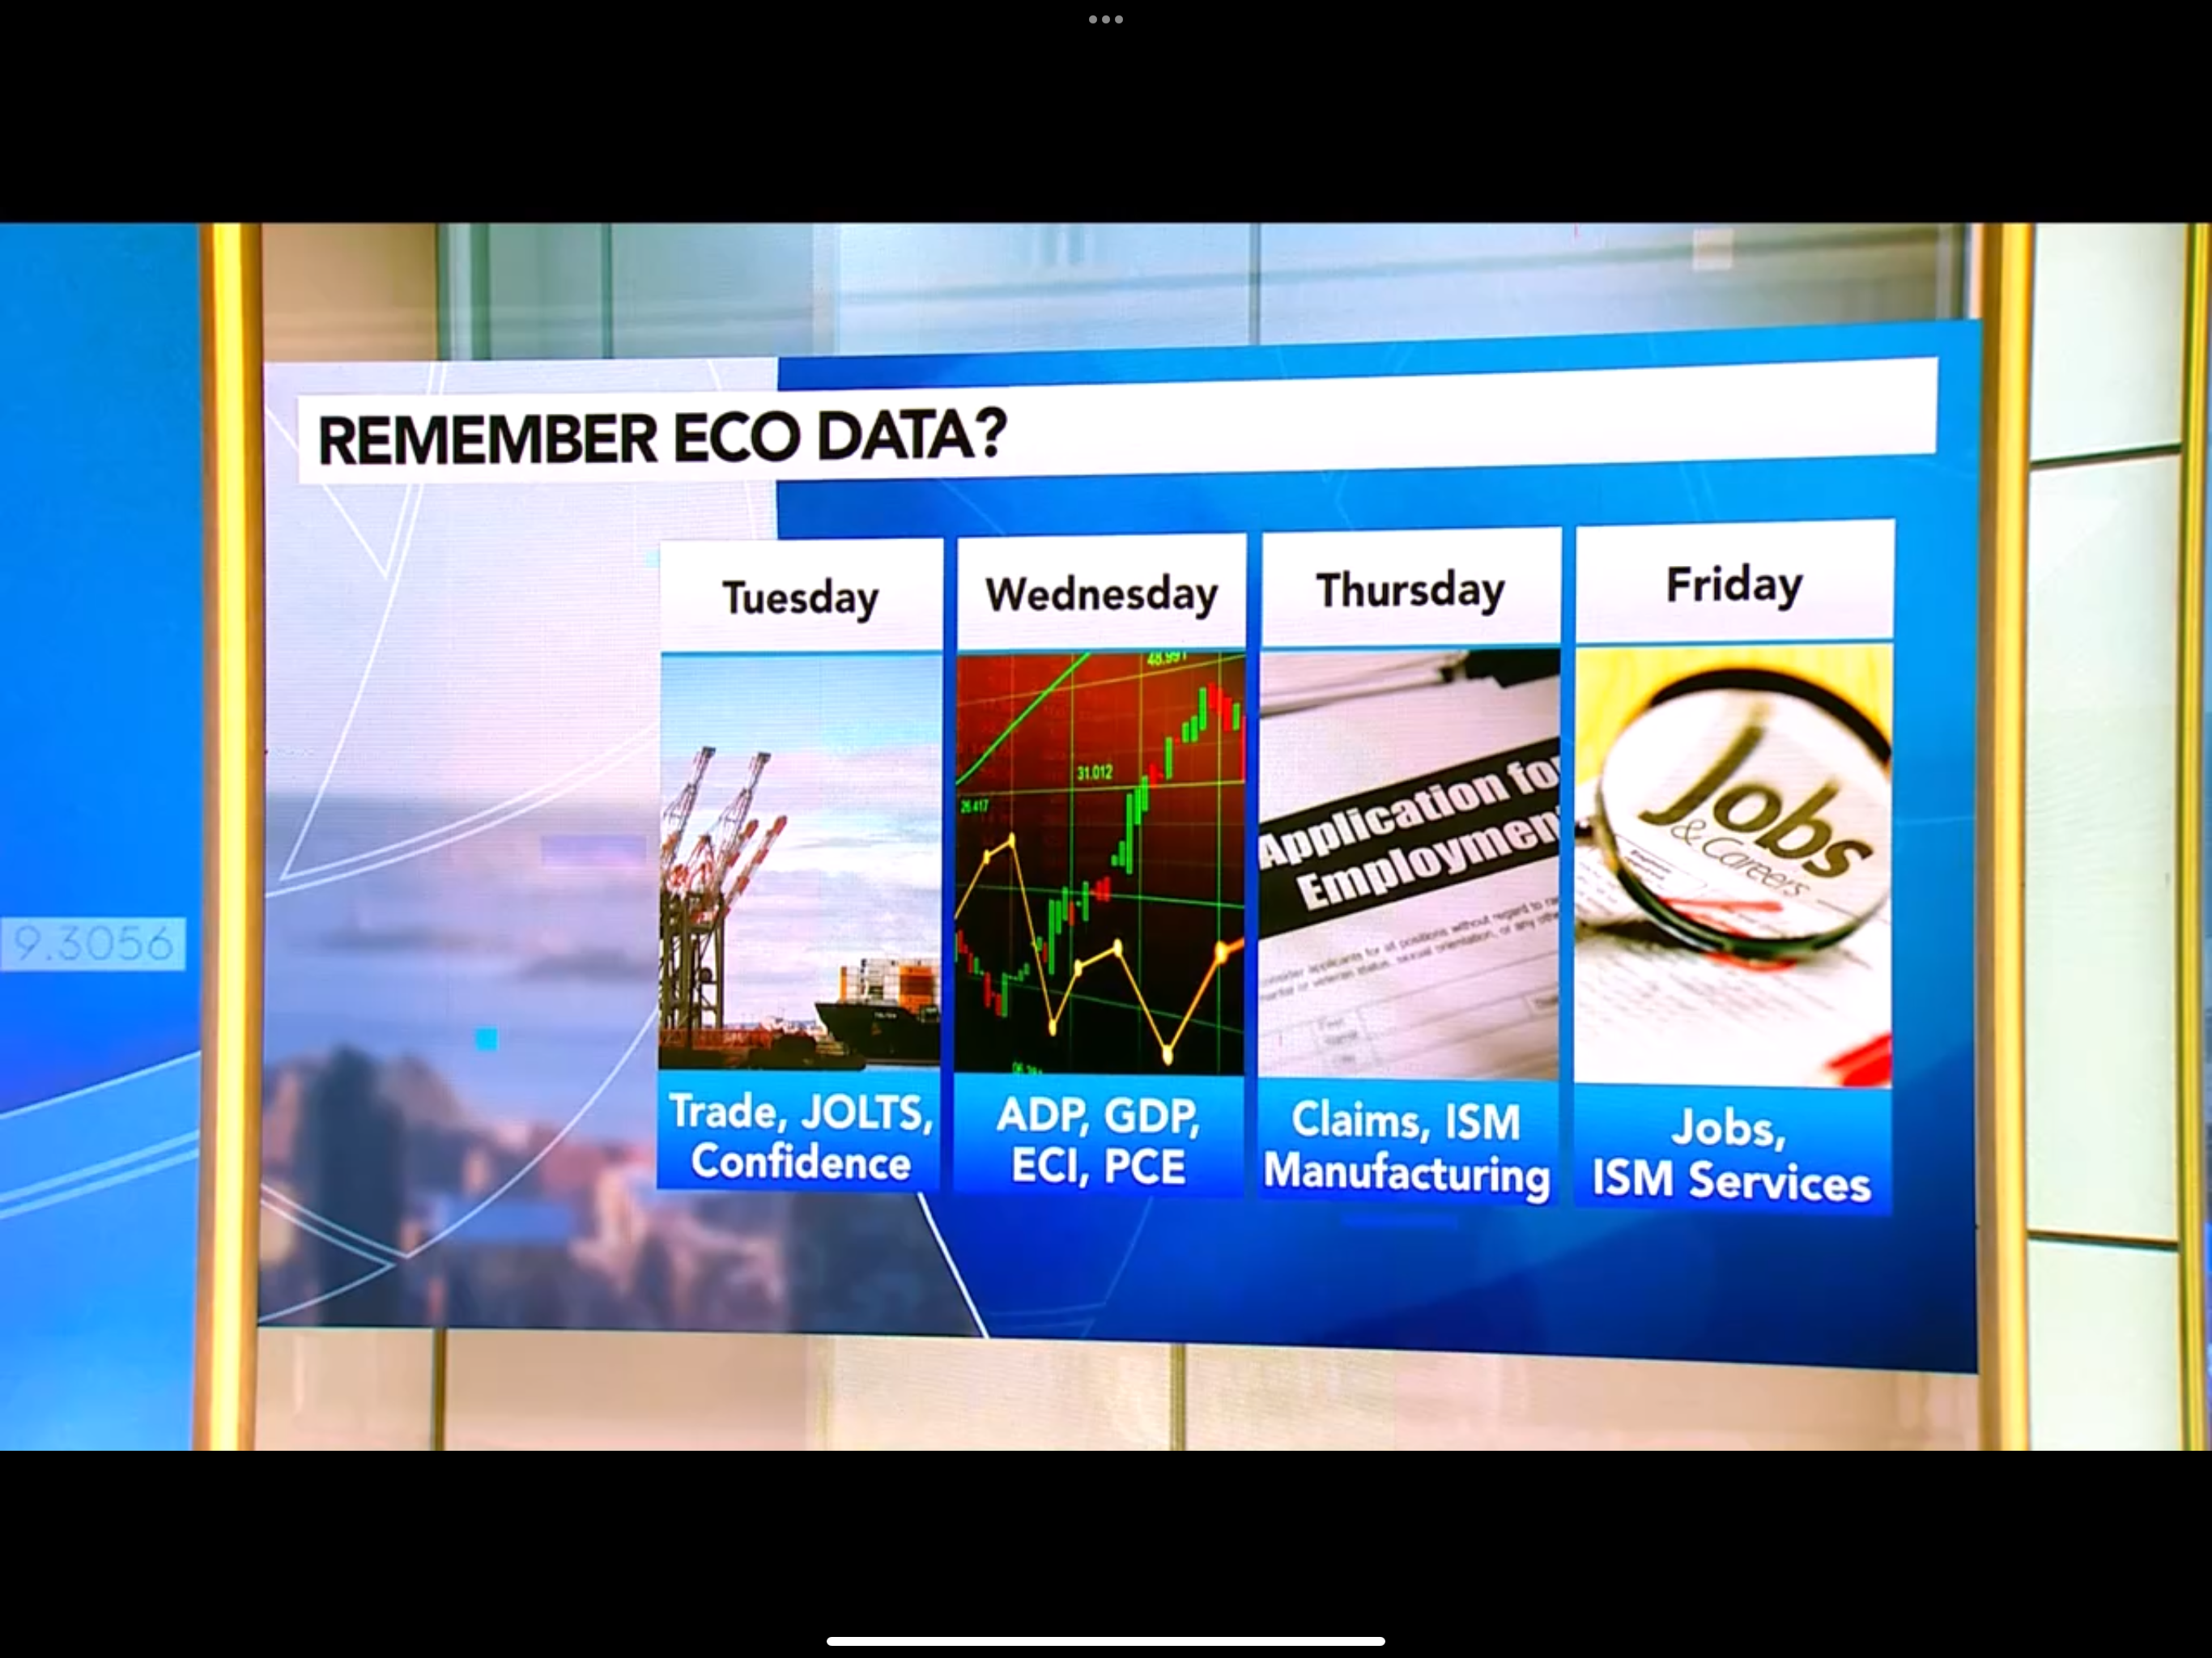
Bloomberg graphic outlines the week’s key economic data releases, including trade and confidence Tuesday, GDP and PCE Wednesday, claims and ISM Thursday, and jobs plus services data Friday.

Tuesday

CB Consumer Confidence, JOLTS, GDPNow.

Wednesday

ADP Jobs, GDP, PCE inflation.

Thursday

ISM Manufacturing and BOJ interest rate decision (unch 0.5%e).

Friday

Non-Farm Payrolls.

Earnings

Wednesday

  • Microsoft
  • Meta

Thursday

  • Amazon
  • Apple

Midweek

  • Visa
  • UPS
  • Caterpillar

SPX Volatility Remains Critical

S&P 500 chart with widening Bollinger Bands shows a volatility spike, a third selloff creating a lower low, and a rebound suggesting markets may be stabilizing after stress.

Also, almost everyone sees a pullback brewing—no surprise given the sentiment tilt:
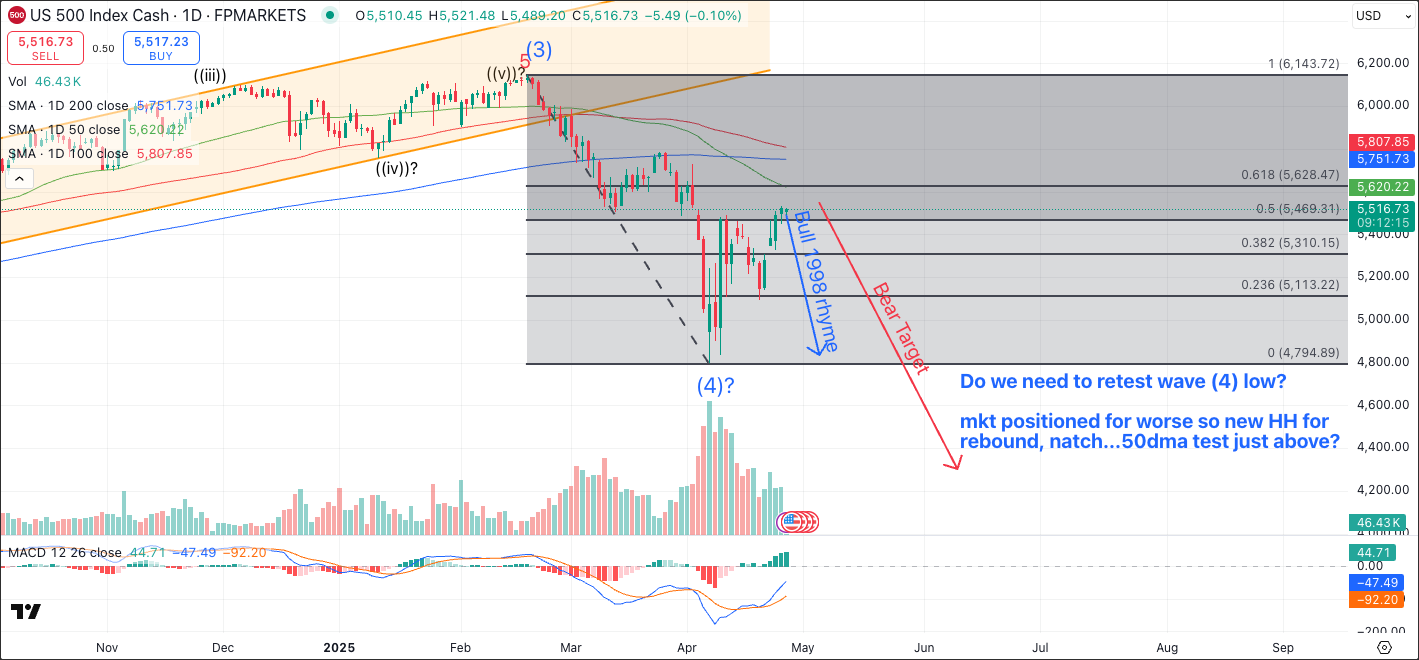
US 500 chart shows a sharp rebound into key Fibonacci resistance with traders watching whether price retests the recent wave (4) low or extends the recovery toward higher retracement levels.

Actionable Takeaway: Half-Full Glass... But It's Still Leaking!

Alpha Capital’s Read

  • SPX facing resistance around Fib levels — next 2–3 sessions critical.
  • Zweig thrust and insider buying hint at medium-term upside.
  • Near-term expect choppiness, headline-driven swings.

Stay flexible. Stay sharp.