Rates, Rotation & Risk-Off Rumbles: The Bulls Blink
Macro moves, chart setups, and sentiment shocks for the week of April 7th, 2025
The Bull Trap Snaps as Macro Reality Bites
It was a brutal week for the Bulls. SPX cracked below support, Bonds surged/Yields cracked, gold exploded to fresh highs, and the market’s soft-landing fantasy took a gut punch. The MAG7 cracked, volatility returned, and cracks in the macro wall are widening into chasms.
The April calendar doesn’t ease up either, CPI and FOMC minutes land this week, alongside bond auctions and Fed speakers. With data weakening and inflation proving stubborn, markets are betting rates will be cut but fighting with Powell and his team suggesting the opposite.
Time to recalibrate. Here’s what matters this week, through the lens of price, policy, and positioning.
Key Market Themes: Cracks in the Foundation
1. MAG7 Cracks: “Back to the Pack” Is No Longer Just a Catchphrase
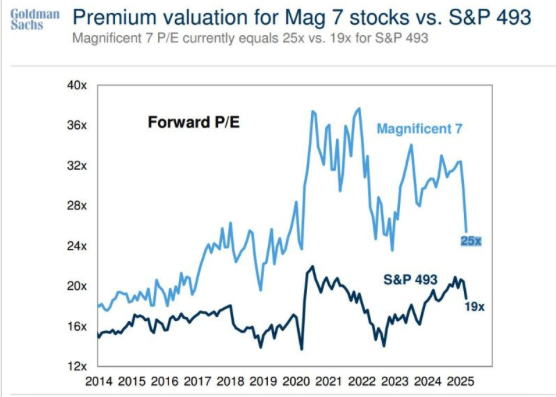
The mega-cap resilience that carried the market is finally cracking. Last week, tech giants like Apple, NVIDIA, Tesla, and Meta suffered sharp drawdowns, dragging down the cap-weighted S&P.
The equal-weight S&P has started to outperform the headline index again suggesting that even in the across the board selling, MAG7 is losing out. This isn’t your standard rotation, it’s a sentiment unwind as the “magnificent” narrative loses its lustre for now.
Fewer stocks are trading above key moving averages post Liberation Day. A reversion to the mean looks to be in full swing.
2. Gold Breaks Out (Again): A Statement, Not Just a Trade
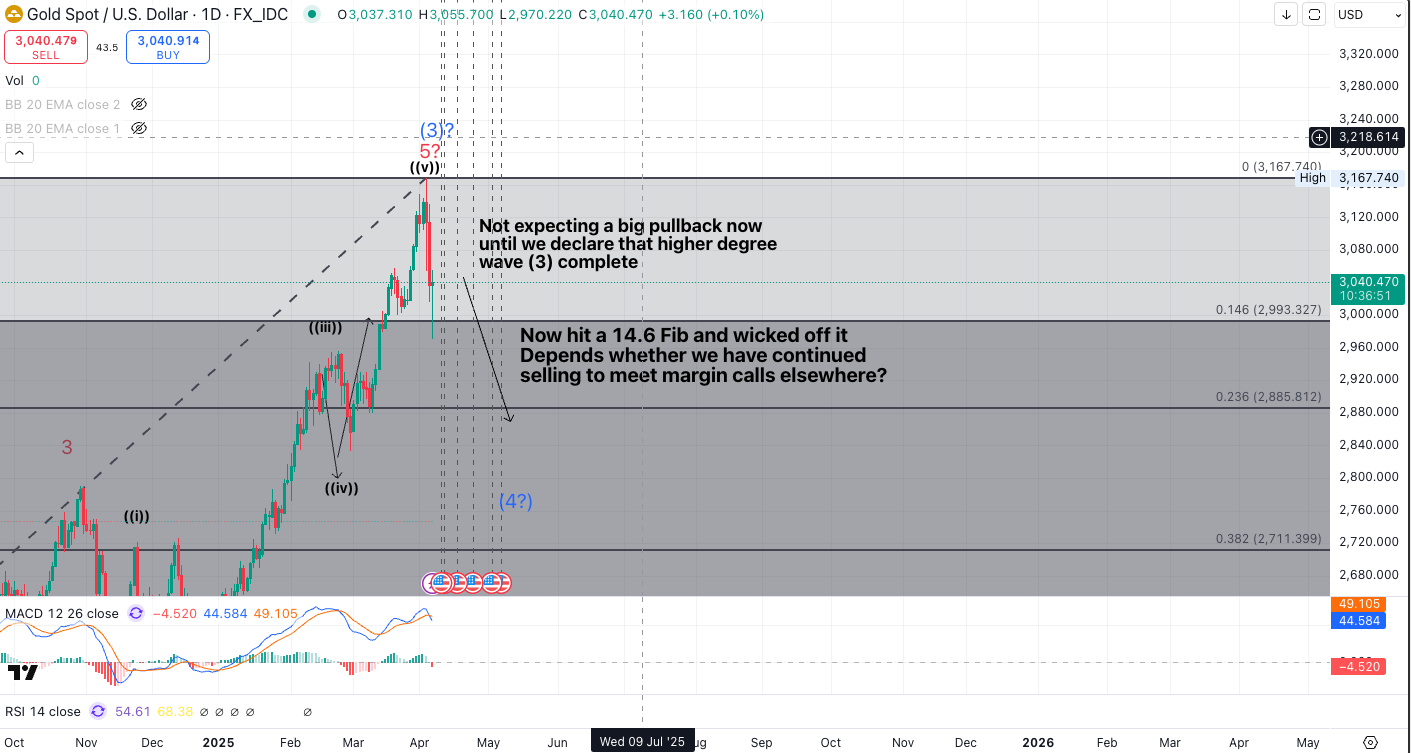
Gold soared through $3,100 printing new all-time highs and confirming its macro dominance. This isn’t a one-off spike, it has been a structural move driven by central bank demand, real yield dislocations,and a global chase for monetary hedges but cracks have appeared.
US yields have started the new week climbing,gold is trading mixed with many spooked by margin selling in the equity fallout at the end of the week. Clear signs that we are at an important level. The price action confirms it’s not just about inflation anymore. Gold is now outperforming both real yields and risk assets, which makes it the cleanest macro long in this environment.
3. VIX Snaps Back: Volatility Is No Longer Cheap
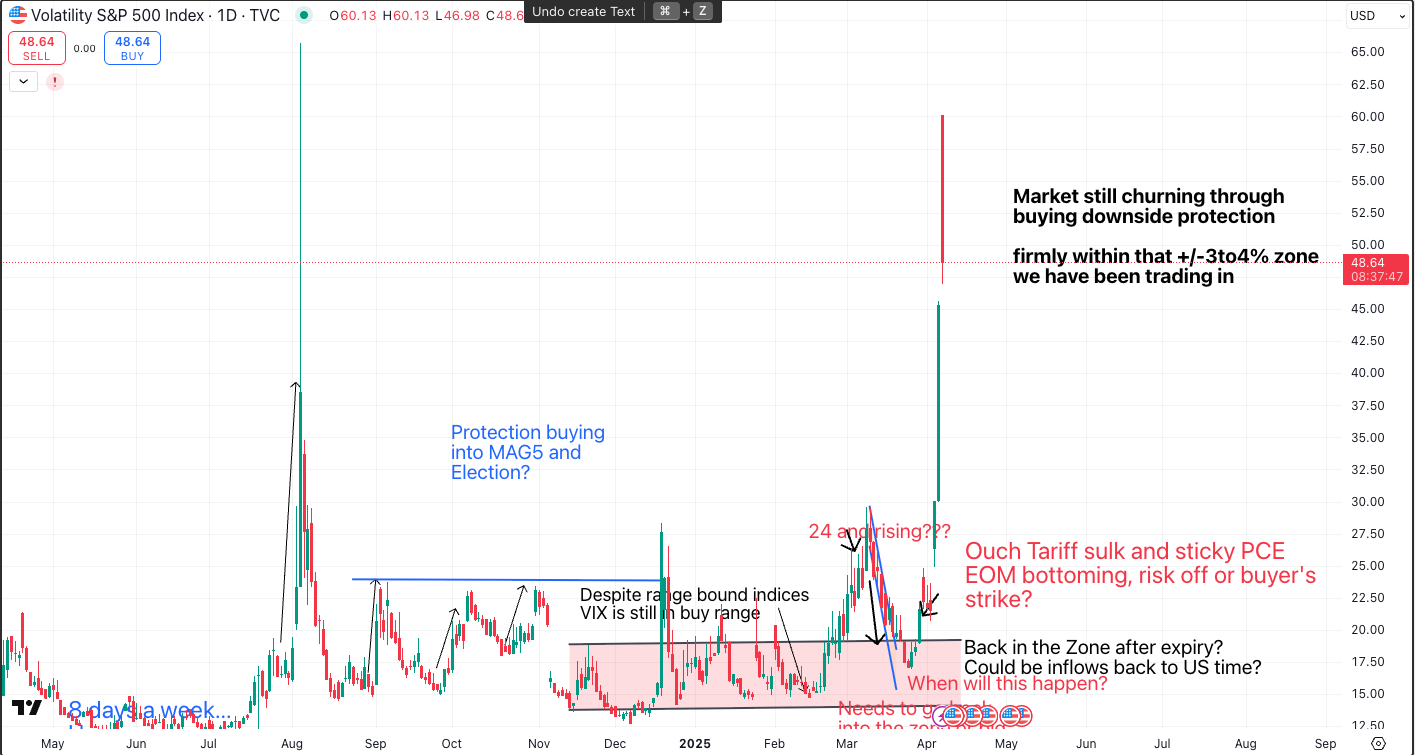
The VIX surged above 40 following the break into the 20s in the previous week.Vol curves are steepening again. After weeks of compression, demand for downside protection has returned in force.
This isn’t your usual “buy-the-dip” backdrop anymore. Volatility flows, especially gamma positioning, are twisting the price action in both directions. Market makers are adjusting rapidly, causing exaggerated intraday swings.
And with CPI and Fedspeak on deck, the re-awakening in vol is just commencing. Expect more two-sided tape and air pockets on even minor news surprises.
4. Bonds Break: Global growth fears surge into bonds
TheUS 10Y yield spiked to 4.4% entering last week, marking a major breakdown in the bond market’s dovish fantasy. We had it as an expected consolidation channel that would fade.
A week later and the Tariff fallout brought in concerns for a US and potentially global growth slowdown. Potentially the return of QE if yields test that 4.5% level. Market hopes for rate cuts jumped to potentially 4 for the year and possibly 50bp in June whatever the Fed is saying outwardly. Sticky inflation and solid jobs data are boxing the Fed into a corner.
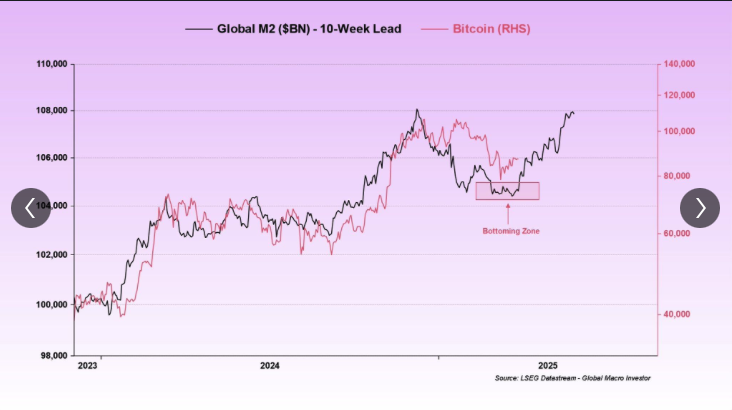
A curveball is Global Money Supply, Raoul Pal has long opined that this leads risk assets by 10-12 weeks and we are in the sweet spot for some mopping up. Bitcoin is his flavour but the markets look like a sweet shop of bargains.
5. Crude Oil’s Whiplash: Geopolitics vs Macro Reality
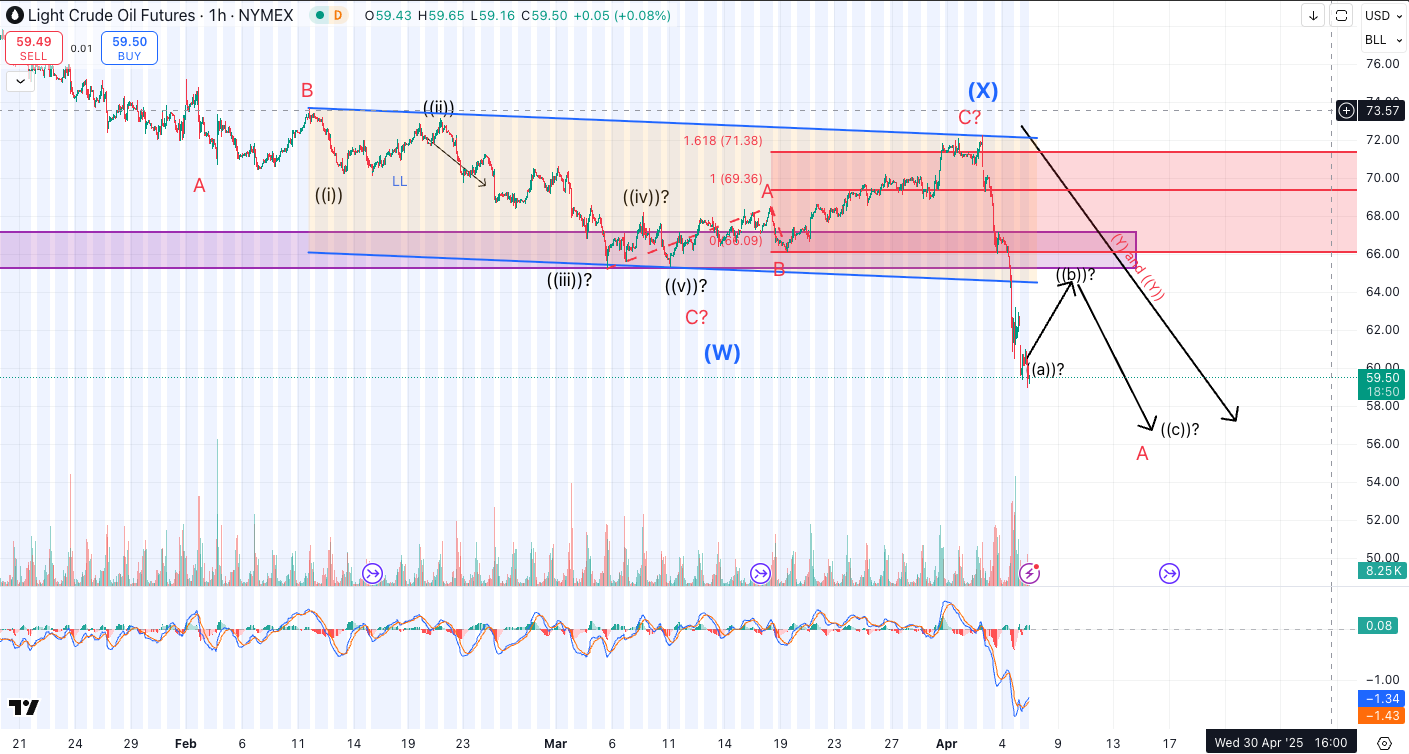
Crude oil had a wild ride, initially rallying on the Middle East risk headlines before fading hard. The failure to hold gainsis telling: even geopolitical tension isn’t enough to override growing demand-side worries.
US inventory builds, lacklustre PMI data, and cracks in consumer spending all point to macro headwinds for crude. The recent drop in oil suggests markets are now pricing in broader growth fears over supply shocks. Plus OPEC+ and the Saudis showing signs of capitulating on price and volumes.
Watch this week’s CPI and PPI closely. If crude continues to fade, it could be a signal for a deeper slowdown, that’s still being masked by headline inflation prints.
Technical & Sentiment Analysis: Bearish Momentum Building
SPX Breakdown: Bearish Structure in Focus
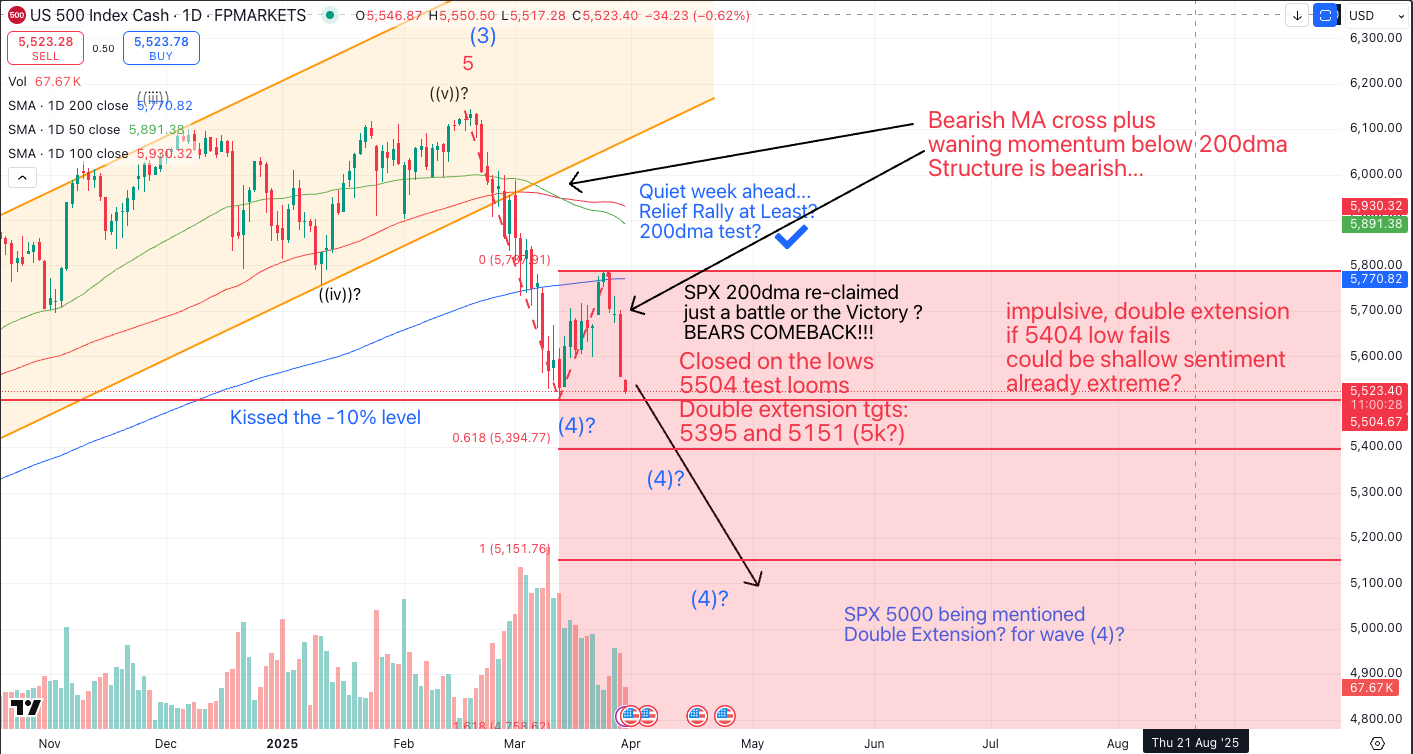
SPX lost key support last week and closed below the trend. The structure now aligns with a bearish ABC or possible start of a larger impulsive wave down.
The 5150–5200 zone is key. A break here opens the downside into the 4950–5000 Fib cluster which looks like hitting on Monday post Asian meltdown. Bears are finally in control, can CPI deliver a miracle? Or will Trump clarity emerge.
Internals Flash “Danger”
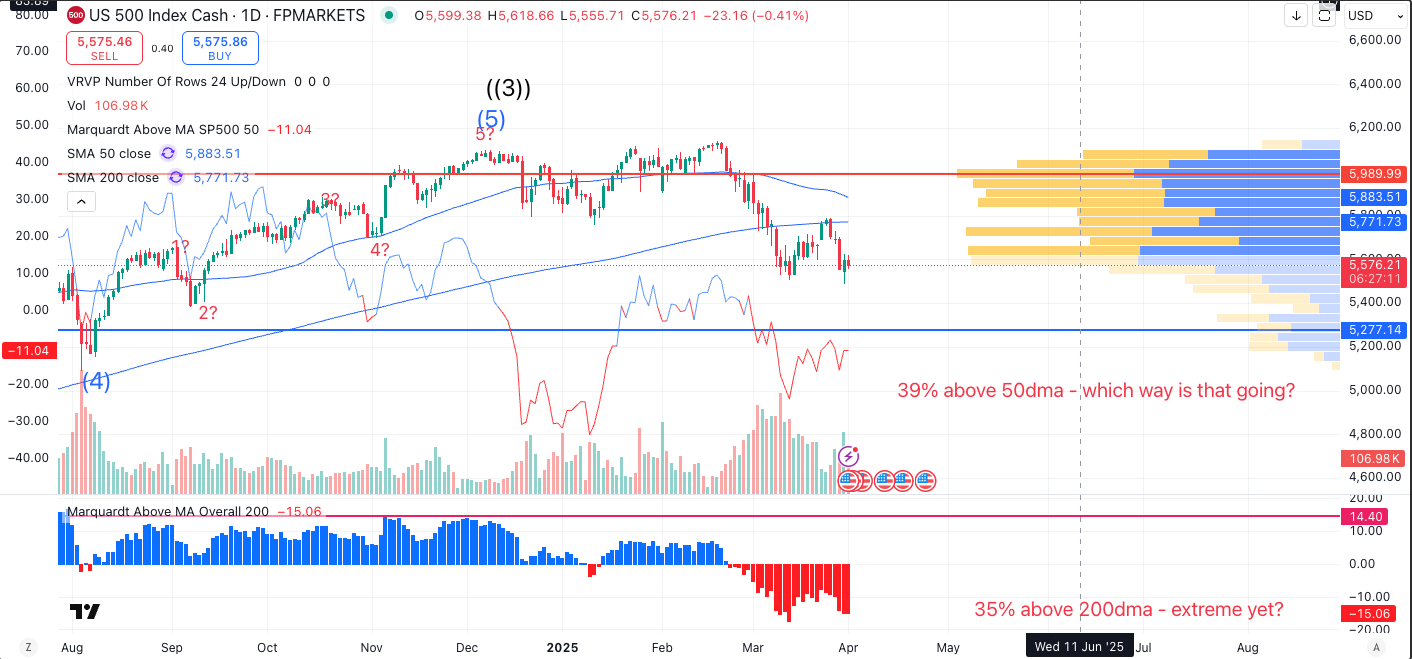
SPX internals, such as the percentage of stocks above their 50-day moving average and relative strength, showed a modest weakening in breadth, but not extreme stress, pre-Tariffs. Participation remains positive overall, especially in cyclicals and financials, though momentum in some sectors is slowing. That quickly reversed on Thursday with the Tariff fallout hitting reverse engine and into defensives. Friday saw full risk on plus margin calls morph into panic.
Dow & Industrials: Panic ahead from the signals?
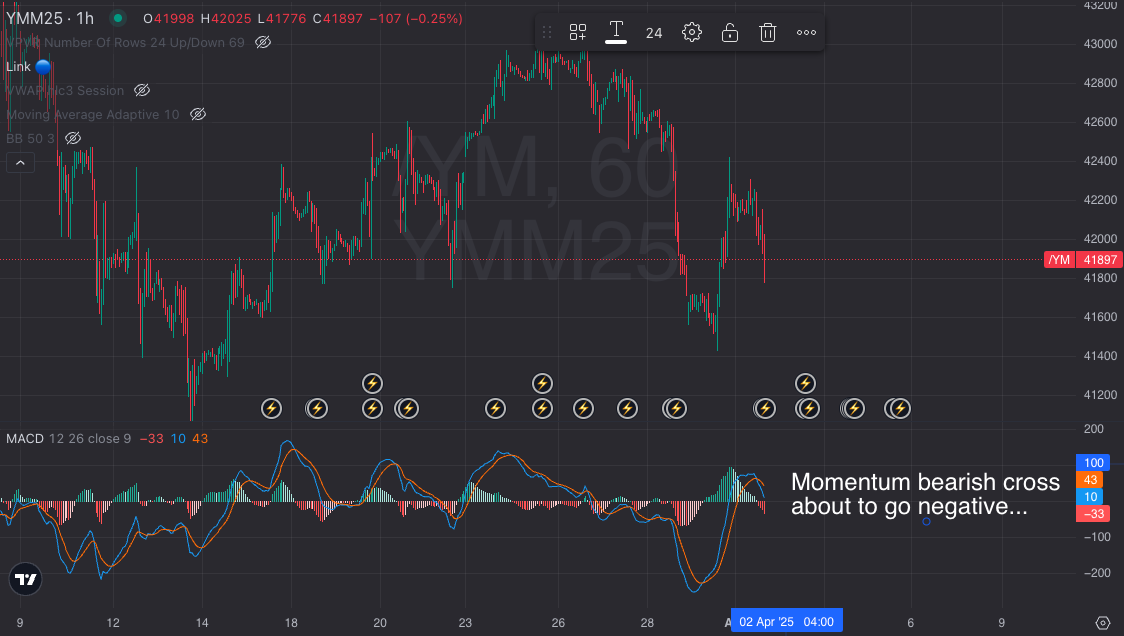
Dow Momentum Collapsing. The DOW, often a proxy for industrial strength, is crumbling. Momentum signals are now outright bearish.
This isn’t just tech weakness, it’s broader market stress.
Last Week’s Recap: Rotation, Reversal & Red Flags
SPX ATH then reversed,Oil reversed hard,VIX jumped.
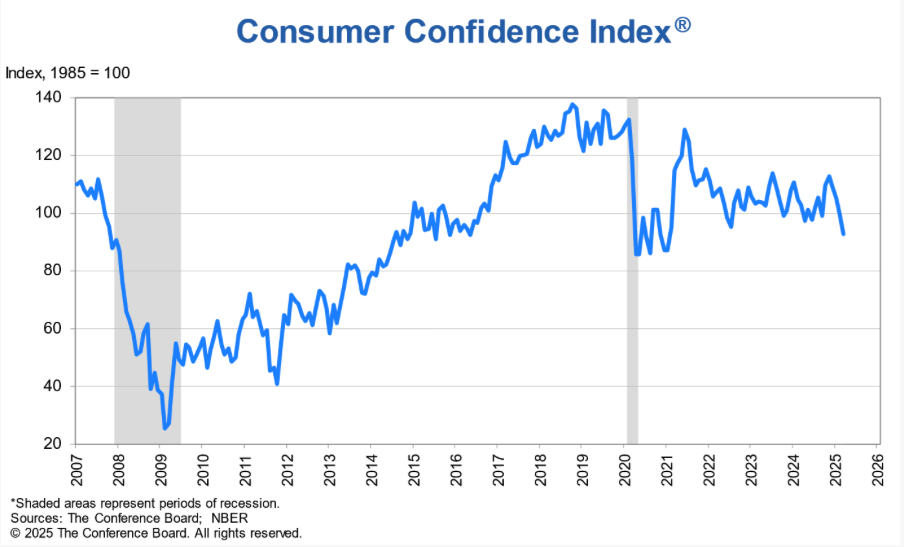
Yields plunged on global growth and US recession odds hit 50/50. Bonds a safe haven.
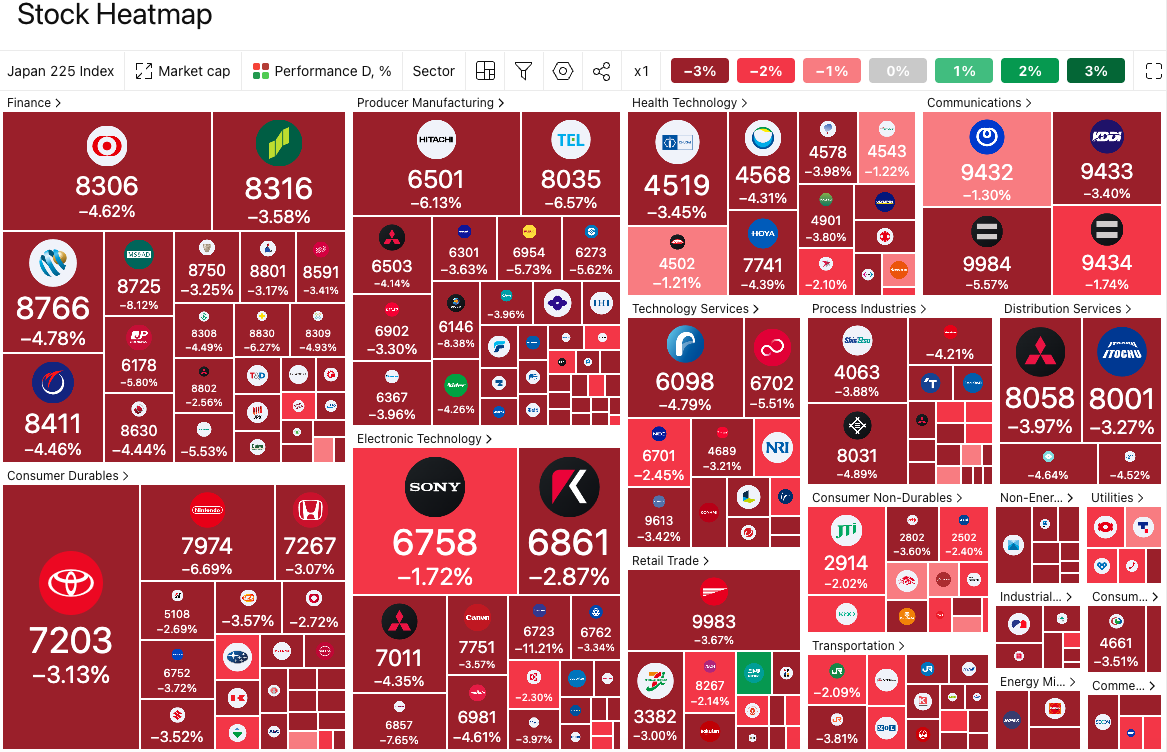
Japan joined the party with a sharp equity correction.
Upcoming Week Ahead: Event Risk Explosion
Monday, Apr 7
No major data.
Markets may digest last week’s moves with positioning ahead of CPI.
Watch US Consumer Credit late in the day for any cracks.
Tuesday, Apr 8
NFIB Small Business Optimism
A window into Main Street. Watch hiring intentions and price plans closely.
Wednesday, Apr 9
NZ and INR rate cuts + FOMC Minutes
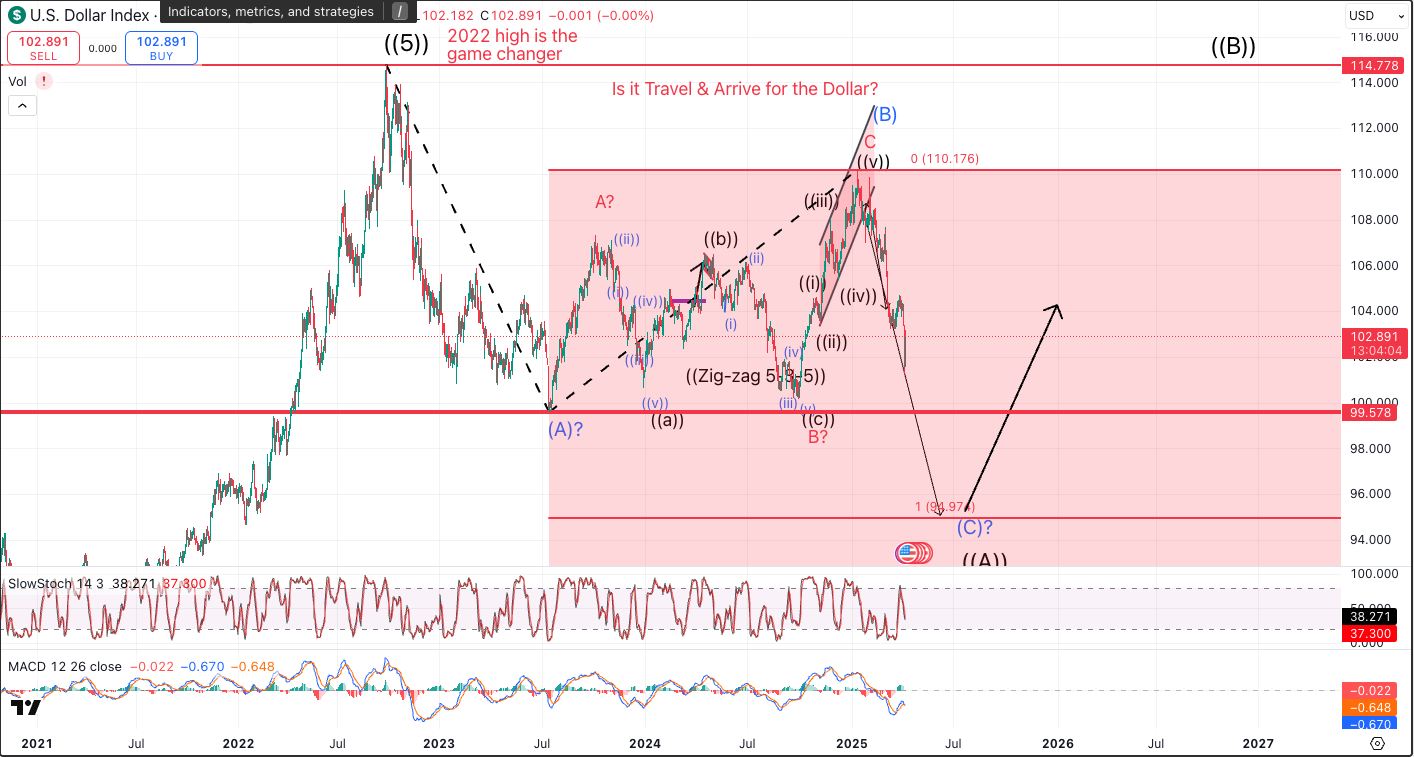
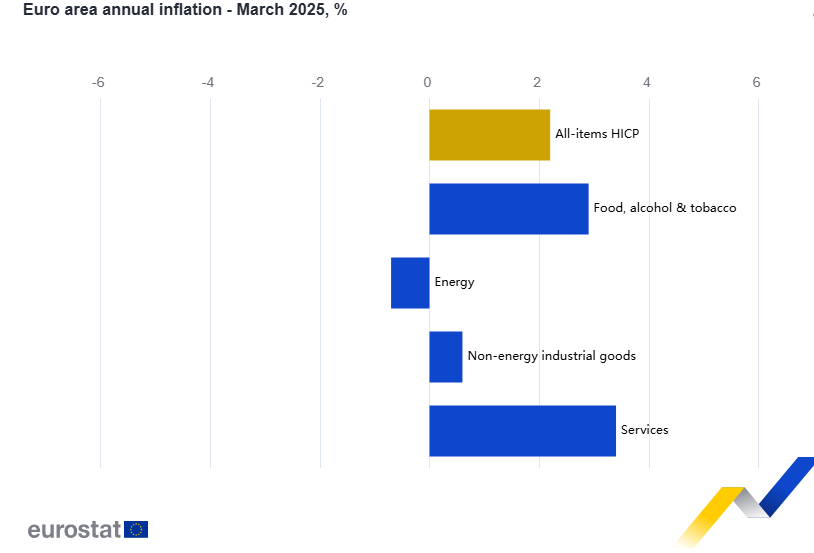
Global Central Bank test…25bp cuts expected, will they do more? Fed minutes may show internal policy rifts but we have even more confusion since. The dollar is still in downtrend with bounces not holding. EZ CPI should allow for cuts.
Thursday, Apr 10
CPI + Jobless Claims
A key inflation/labour combo. Expect rate cut odds to shift sharply based on these prints. The Fed needs room on inflation to press go on any rescue cuts. Federal Job cuts not really showing up yet.
Friday, Apr 11
PPI + UoM Consumer Sentiment
PPI will complete the set for inputs to PCE.
UoM Sentiment was already shaky, another drop could reinforce the recession narrative. Kugler acknowledged the 1Y and 5Y inflation breakouts in this survey…the Fed do watch!!
Actionable Takeaways: Time to Play Defense
A rally toward 5285–5300 without new news is a likely sell.
SPX market structure was indeed broken. Tariff headlines broke the support and the new LL has caused a double extension sell off. Momentum has now put in a LL so some form of relief rally is possible. Bear markets go up more days than down but impulsive moves down tend to wipe out any gains. If Trump stands firm expect a Low retest below 5000…Rallies should be held around 5300 for now.
Gold is still the macro hedge of choice, but profit-taking and margin calls get in the way.
Watch for a dip toward 2700-2800 as a reload zone. A retest of 3167 ATH is crucial for whether we have topped out an 18 month bull run. Rate cuts are flip flopping and Powell vetoed early cuts on Friday, but QE is a possibility if Bonds start being sold from overseas. Gold has seen margin call selling to finance other positions…A hotter CPI and DXY bounce could trigger a temporary flush. Structurally, new highs are in play medium term if rate cut expectations rebuild.
FX signals defensive rotation, stay long JPY and CHF?
USDJPY tested 145 and opens up room for a break lower. Yen is bid as BOJ tightens liquidity. Look for signs the DXY resumes downtrend for new Yen strength. CHF remains a tricky risk-off long, as SNB rhetoric could muddy the waters.
Volatility trades are back on.
With CPI, FOMC minutes, and fragile sentiment into earnings, straddles or gamma setups offer attractive risk/reward. VIX breakouts are causing extreme market hedging. Sequential 4%+ down days followed by a Monday Asian follow through, look for a bit of mean reversion and a relief rally but the market is still short gamma and needs to re-balance.
Oil breakdown due a pause but fade it.
The break of the support zone around $65 has seen a test below $60. The Saudis have started to slash their own prices…we are close to the end of the expected 5 waves down. Look for a re-test of $64 channel bottom then global demand worries probably take-over again.
Final Verdict: Stay Nimble, Stay Realistic
The market is recalibrating to a stronger-than-expected macro backdrop. While risks are rising, the bull trend hasn’t fully broken yet. This is a time for defensive positioning, selective risk-taking, and short-term tactical plays over broad exposure.