Markets enter the final week of July with a noticeably different tone after geopolitics, rising rates and AI-capex concerns made investors more wary. The lull in US-Iran hostilities has helped oil pull back and supported an early risk-on response, but the underlying questions have not disappeared. Oil remains tied directly to the inflation debate, while Tech earnings and valuations remain a key focus after recent concerns around capex and cash flow. This is a market recap, not a recommendation to buy or sell.
Beneath the surface, the picture remains more supportive than headline weakness suggests. Market breadth has held up, retail inflows remain strong, and buybacks are set to return after this week's reporting rush. However, systematic funds are already heavily invested, hedge funds have unwound Tech exposure, valuations remain expensive, and options positioning offers less volatility insulation. The setup is not outright bearish, but the balance between strong fundamentals and increasingly fragile positioning has become more important.
Market overview: earnings strength meets a more cautious tape
The equity backdrop remains unusually two-sided. The report notes that hedging flows have driven much of the recent selling volume, while breadth, particularly on down days, suggests the underlying market remains sound. More than 70% of S&P 500 stocks recently traded above their 200-day moving average for the first time in almost six months, and in 14 of the previous 17 such cases, the S&P 500 was higher two weeks later.
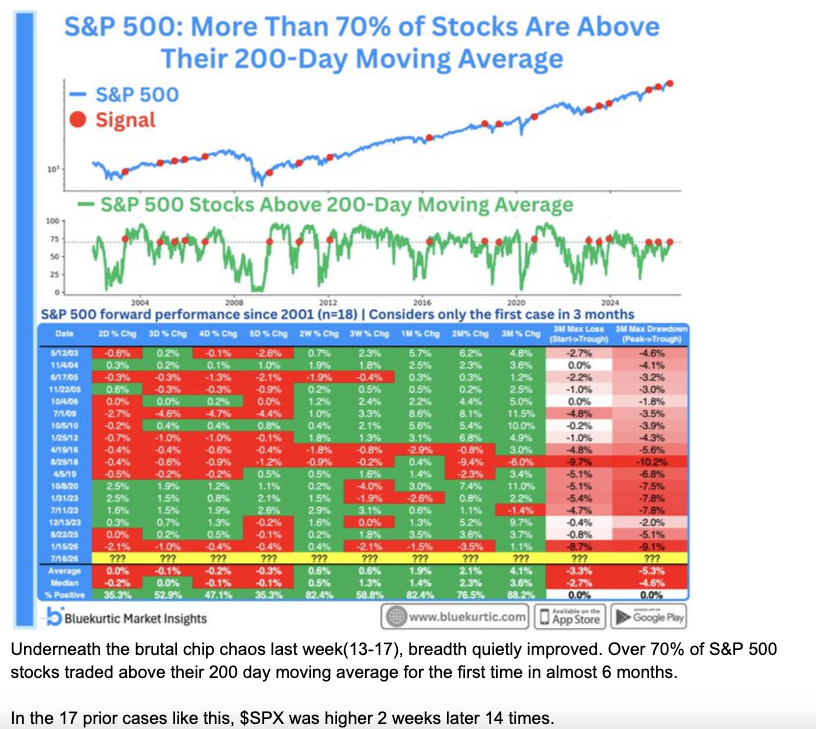
Equity selling has been two-sided: hedging flows versus still-positive breadth.
Earnings provide the strongest fundamental support. Q2 is running at an exceptional 37.9% earnings growth rate so far, compared with an already elevated 23.2% at the end of June. At the start of the week, the magnitude of earnings beats was +16.4% year-on-year, almost matching Q1's +16.6%, while net profit margins are on track for 15.7%, the highest in the series going back to 2009.
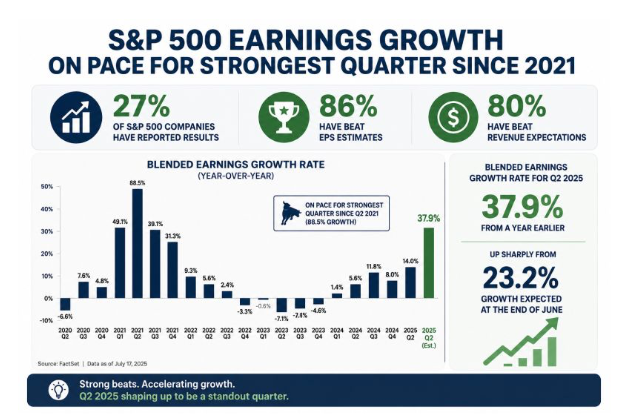
Q2 earnings growth is running at 37.9%, above the already elevated June pace.
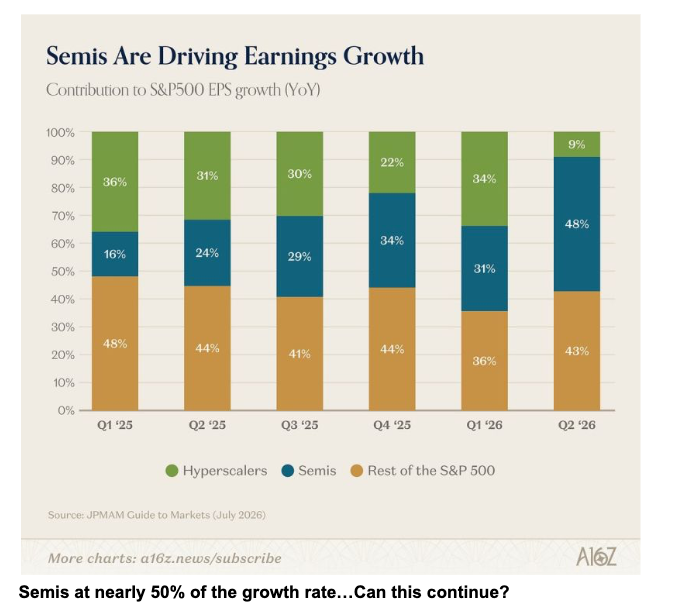
The problem is that investors are demanding more than headline beats. Losers are being punished more heavily than winners are rewarded, and Alphabet and Tesla renewed the debate around elevated AI capex and cash flow. Semiconductors account for around 48% of the earnings growth rate, while this week's mega-cap updates should keep the focus on AI capex, cash flow and whether monetisation can justify the capital being deployed.
Misses are being punished more heavily than beats are rewarded.
Oil is the other major pivot. Brent has reached the 50% Fibonacci retracement and moved into the key zone toward the 61.8% retracement of the recent sell-off. The report had been looking for this area as a potential turning point, meaning trading longs now need to watch whether the relief move develops into a more durable reversal.
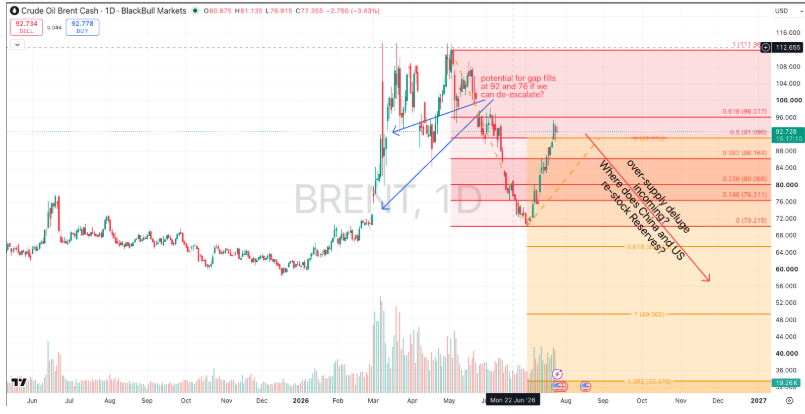
Brent has reached the 50% Fibonacci retracement of the recent sell-off.
Macro and policy: oil keeps the rates debate complicated
The Federal Reserve sits at the centre of this week's macro outlook. Current CPI has been softer than expected, but higher oil has raised concerns around year-end and longer-term inflation expectations, including whether secondary effects eventually reach non-oil prices. The probability of a September hike had risen to 82%, while the odds of a July move reached 36%, leaving Wednesday's decision and Warsh's communication particularly important.
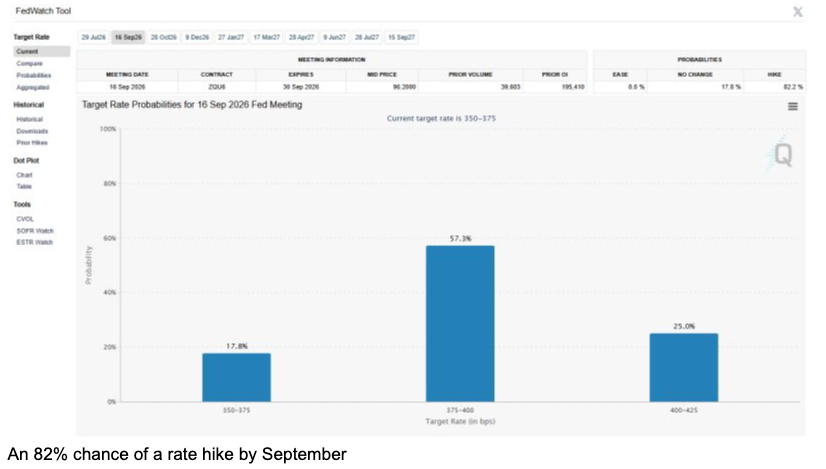
September hike odds had risen to 82%, with a 36% chance of a July move.
Longer-term inflation pricing is elevated but not extreme. The Fed's five-year, five-year forward inflation rate rose seven basis points last week to 2.28%, around the middle of its five-year range. US 10-year TIPS yields also remain within what the report describes as a normalised zone, suggesting rates look more alarming relative to the zero-rate era than against pre-money-printing history.
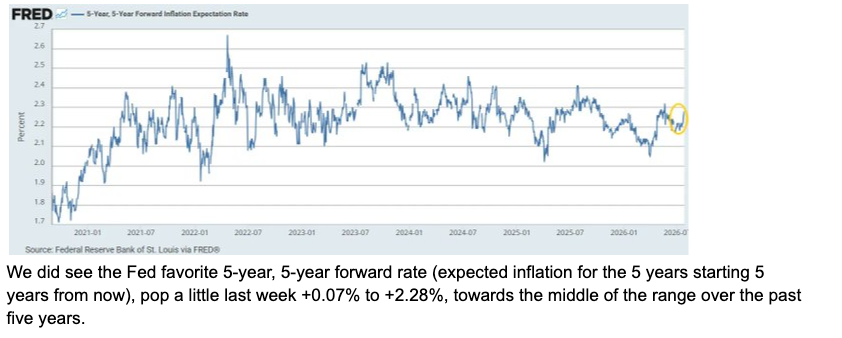
The Fed 5y5y forward inflation rate rose 7bp to 2.28%.
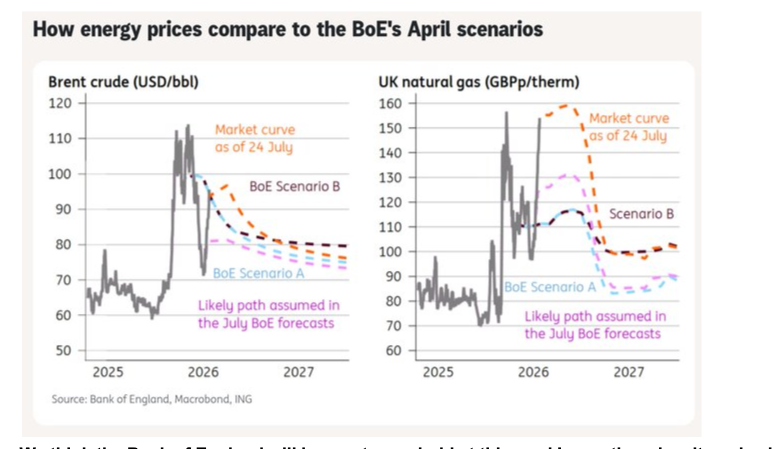
The BoE and BoJ add to the policy risk. UK flash PMI improved to 52.1 from 49.3 in June, with manufacturing posting its strongest growth since September 2024 and new orders growing at their fastest pace since February 2022. Despite higher energy prices, the view highlighted in the report is that the BoE keeps rates unchanged this week, while the BoJ has signalled it could move faster than the previous six-month gap between actions.
UK flash PMI improved to 52.1 from 49.3 in June.
Geopolitics remains inseparable from oil. The lull in US-Iran fighting has provided relief, but the supply picture remains complicated. Even closing the two key straits would not completely stop oil flows, with the SUMED pipeline providing an alternative route near the Suez Canal, although the additional transport costs would feed directly into futures pricing.

The SUMED pipeline remains an alternative oil route near the Suez Canal.
Credit is another area to watch, with the report highlighting CLO risks alongside expanding AI-related debt issuance and concerns around NVDA credit risk. AI-related debt issuance is estimated at $489bn so far this year, already above the full-year 2025 estimate of $322bn, with only 40% coming directly from hyperscalers.
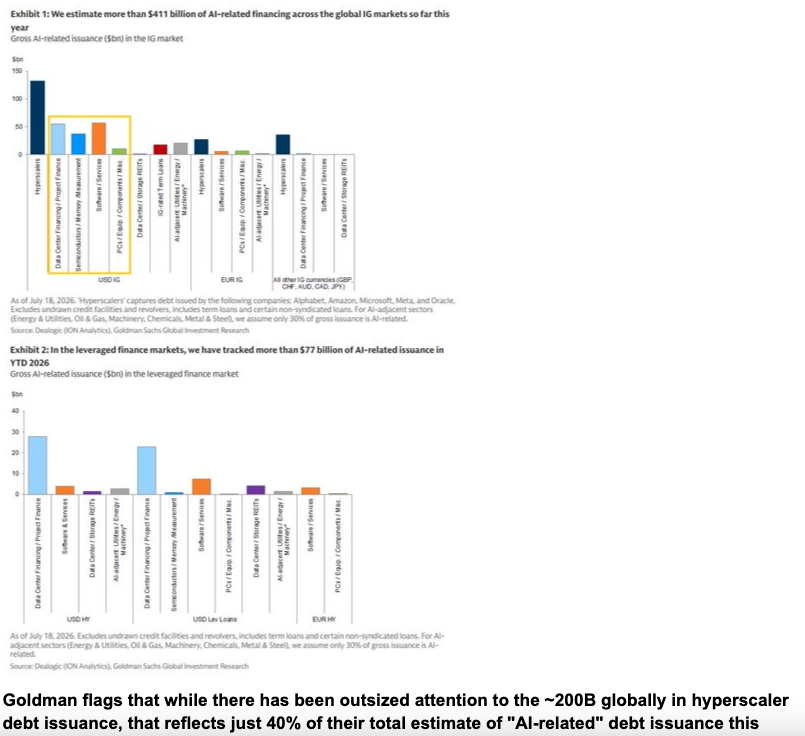
AI-related debt issuance is $489bn year to date, above the full-year 2025 estimate.
Technical and sentiment: supportive, but increasingly fragile
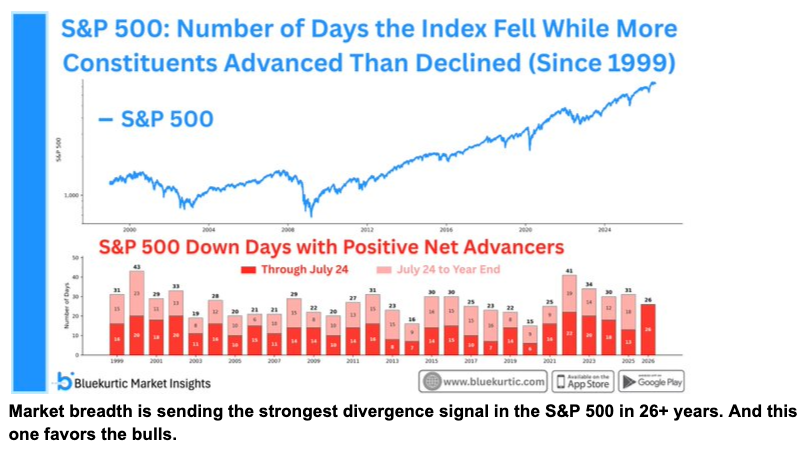
Market structure remains constructive enough to resist a straightforward bearish reading. Breadth has stayed positive even during index weakness, and the divergence between the S&P 500 and underlying participation suggests hedging flows have played a meaningful role in recent selling rather than broad liquidation.
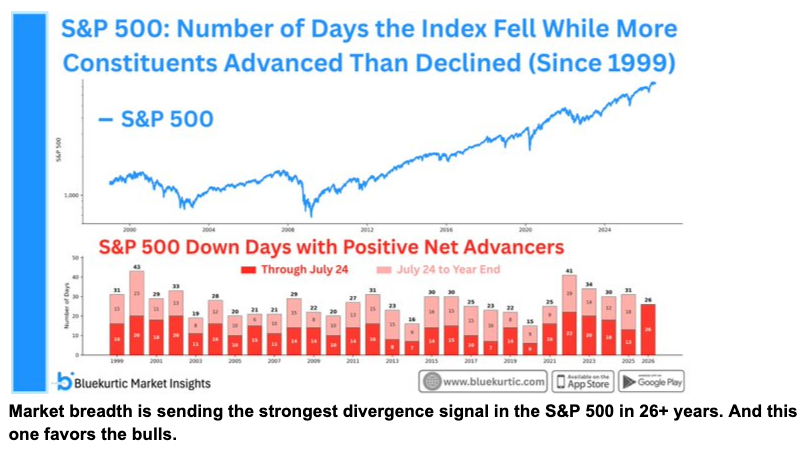
S&P 500 down days with positive net advancers, the strongest breadth divergence in more than 26 years.
Tech positioning, however, has changed dramatically. Hedge funds have sold information technology stocks in six of the past eight weeks, taking eight-week sales to the largest in at least a decade. Tech exposure as a percentage of total hedge-fund market exposure has fallen to its lowest since February 2026, while discretionary positioning has returned to early-April lows.
Systematic positioning creates a different vulnerability. Vol-control equity allocation has reached the 96th percentile, while CTAs are already close to maximum exposure. The report stresses that this is not inherently bearish, but it means there are fewer incremental systematic buyers on further upside and greater downside asymmetry if conditions deteriorate.
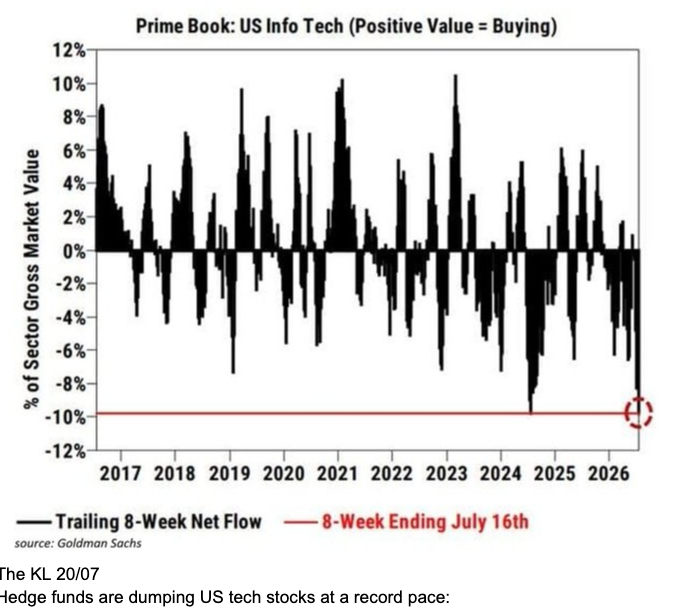
Hedge funds have sold information technology in six of the past eight weeks.
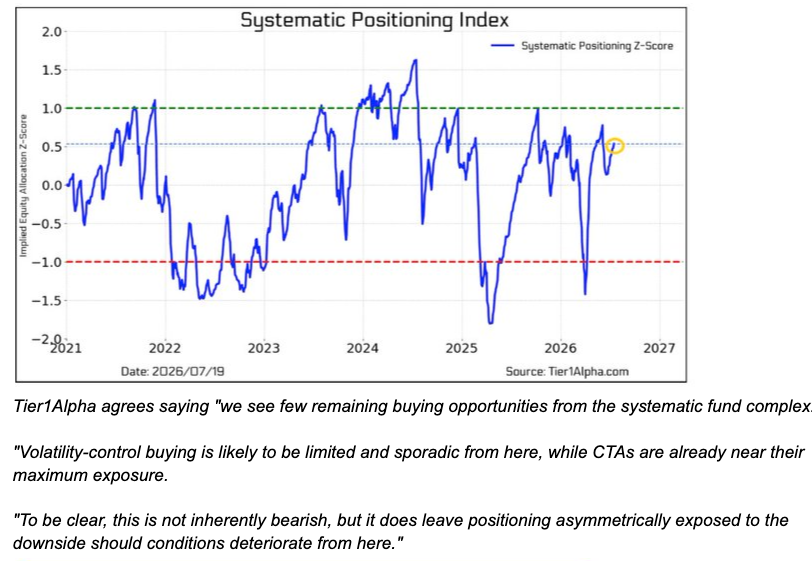
Vol-control equity allocation has reached the 96th percentile.
Gamma has also become less supportive after options expiry. Tier1Alpha estimated that the S&P 500 had moved modestly into short gamma, with implied resistance around 7,625 and support near 7,400. The 7,300 area is particularly important because it coincides with the CTA threshold for heavier selling and an estimated gamma flip point, where dealer hedging could amplify weakness.
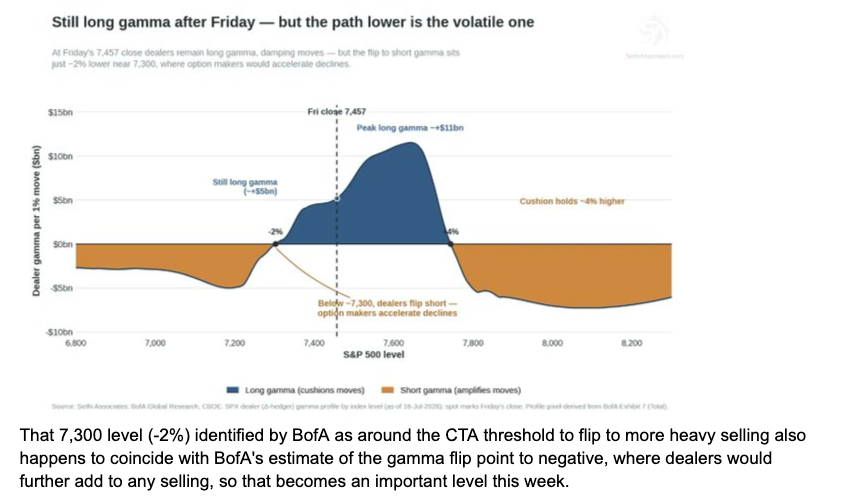
S&P 500 gamma: resistance around 7,625, support near 7,400, with 7,300 as the flip zone.
The sentiment picture remains complicated rather than outright fearful. Put buying has lifted the put/call ratio back toward average levels, suggesting hedging activity has already increased, while momentum stocks such as NVDA have underperformed low-volatility counterparts at a historic pace. With hedge funds also cutting long exposure by roughly 5%, the report asks whether enough of the risk adjustment has already occurred to allow a bounce.
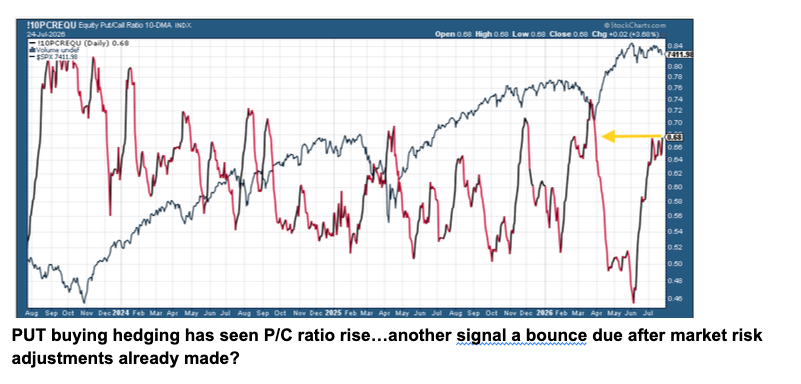
Put buying has lifted the put/call ratio back toward average levels.
Seasonality adds another layer. The market is approaching the usual Summer Retreat period, but the report stresses that this is a Trump midterm year and the final week of July is normally seasonally strong. That makes fading an equity rally without a new catalyst a potentially difficult trade.
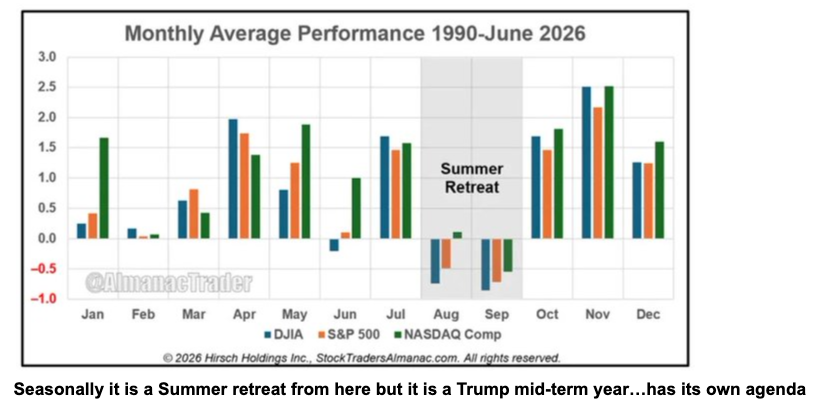
The final week of July is normally seasonally strong in a midterm year.
Last week's recap
The past week brought a clear change in market tone. Geopolitical tensions, rising rates and AI-capex concerns increased caution, but strong earnings, improving breadth and resilient flows prevented the move from developing into a broader risk unwind.
Macro
The Citi Economic Surprise Index rose to 57.1, remaining close to its June 5 reading of 63.20 and marking the strongest sustained seven-week period since October 2023. US services activity accelerated, while manufacturing PMI eased to a four-month low of 53.8, with the report also pointing to intensifying price and supply pressures.
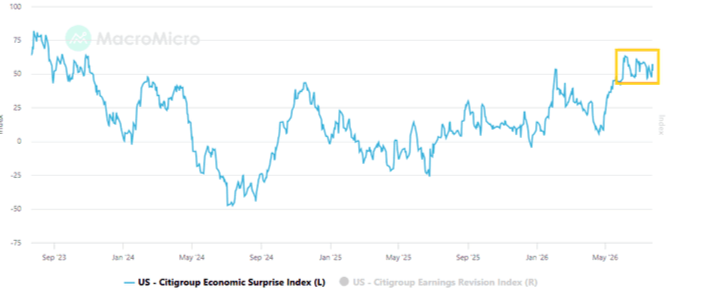
The Citi Economic Surprise Index rose to 57.1.
China
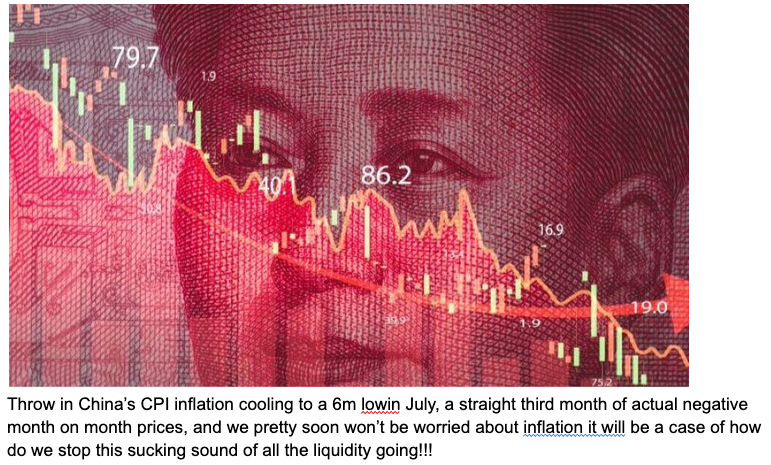
China remained central to the Tech story as token costs fell to a 3.5-month low and its semiconductor industry gained attention. A Chinese chipmaker jumped 472% on debut in the second-largest IPO in the country's history, while TSMC was reported to be raising chip prices by around 10%.
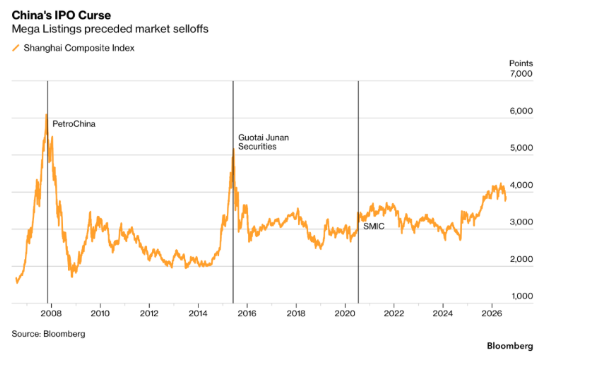
China mega-listings have preceded market selloffs before.
Earnings
Q2 earnings remained exceptionally strong, but the market's reaction became more selective. Alphabet and Tesla disappointed around capex and cash flow, while misses were punished more heavily than beats were rewarded. With the earnings run rate reaching 37.9%, the question is whether this represents peak earnings or the beginning of another push higher.
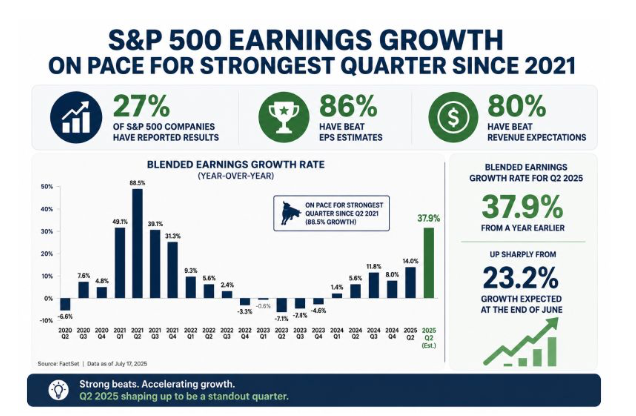
Q2 earnings remain exceptionally strong even as the reaction turns selective.
Commodities
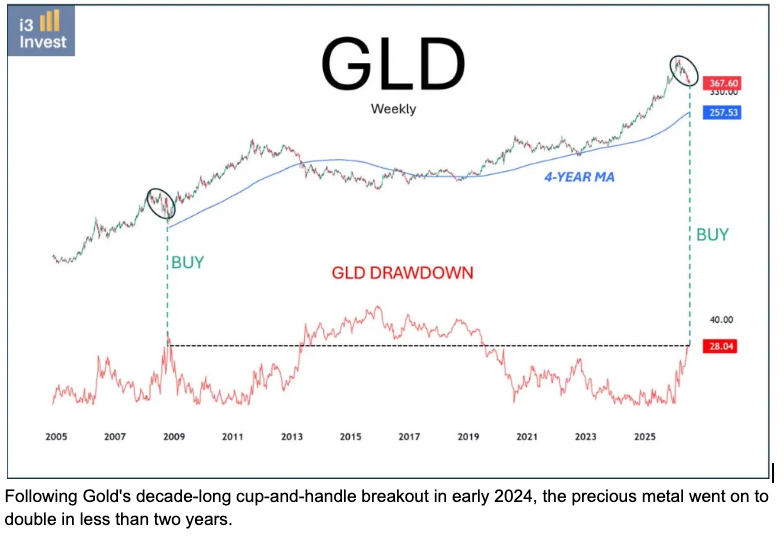
Gold began reacting positively again despite higher real yields. Following its early-2024 breakout, the metal doubled in less than two years before falling 28% from its January blow-off top, its largest correction of the current multi-year run. Gold miners also broke their downtrend following their best two-day rally since the start of Q2.
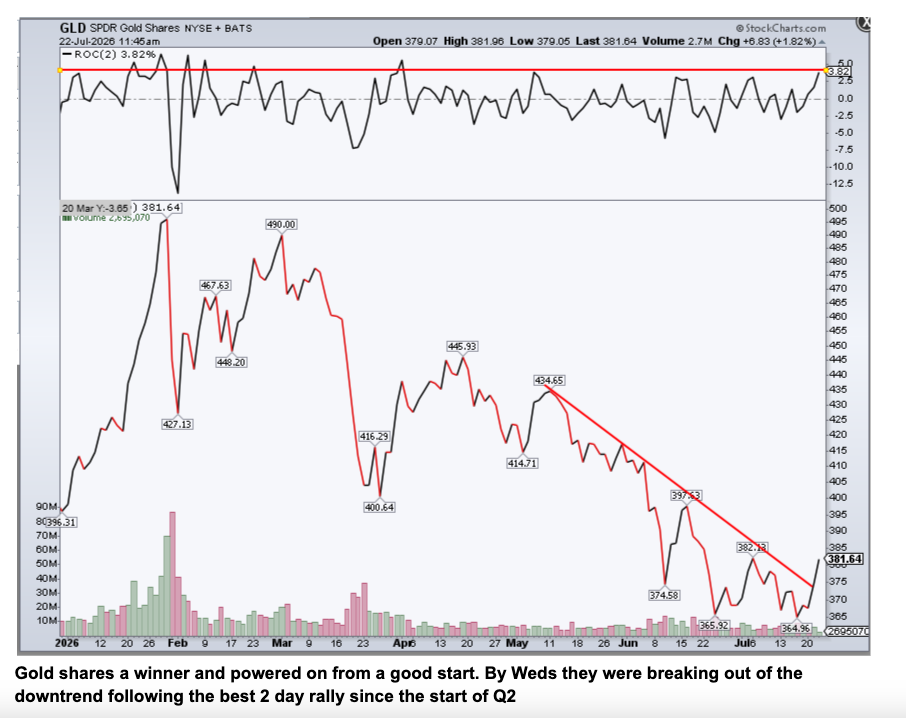
Gold doubled after the early-2024 breakout, then fell 28% from the January top.
Gold miners broke their downtrend after their best two-day rally since the start of Q2.
Crypto
Crypto absorbed recent disappointments relatively well, but ETF outflows remain the key near-term concern. The report notes signs of resilience and improving buy territory across the broader market, while questioning whether further outflows could shift relative preference toward gold.
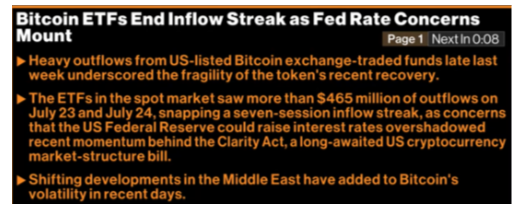
Crypto ETF outflows remain the near-term concern.
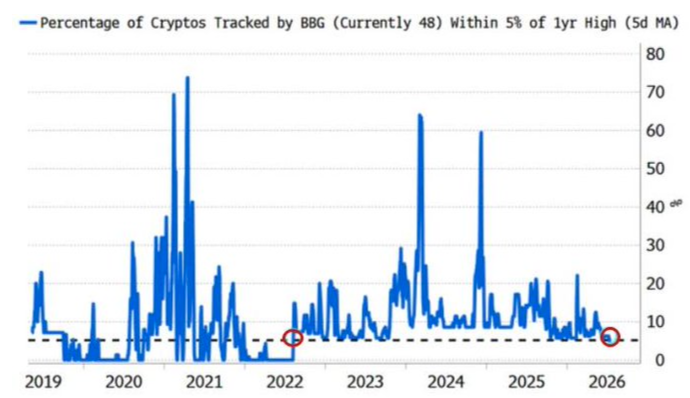
The broader crypto market is moving closer to buy territory.
Oil
Oil pulled back as US-Iran talks and the lull in hostilities brought some relief after the recent spike. Brent has now reached the technical retracement zone the report had been watching, leaving the next move dependent on whether geopolitical relief holds and price confirms a reversal.
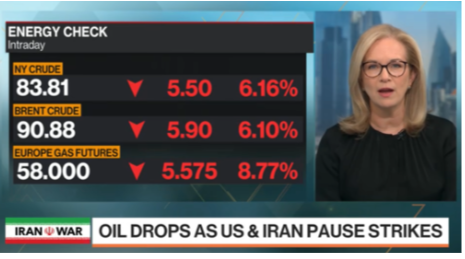
Oil pulled back after the lull in US-Iran hostilities.
The week ahead
The week is packed with macro, policy and corporate catalysts. US GDP, personal income and spending lead the data calendar, while Treasury auctions are concentrated into Monday and Tuesday ahead of the FOMC. Earnings are equally important, with 34% of the S&P 500 reporting, including four Mag-7 companies and another 29 companies above $100bn in market cap, alongside a major update week for global autos.
Monday, July 27
- China: Industrial Profits
- Germany: Ifo Business Climate, Business Expectations and Current Assessment
- Eurozone: M3 Money Supply and Private Sector Loans
- US: Durable Goods Orders and Core Durable Goods Orders
- US: Non-Defence Capital Goods Orders Ex-Aircraft
- US: Atlanta Fed GDPNow
- US: 2-Year and 5-Year Treasury Auctions
- Korea: Consumer Confidence
Tuesday, July 28
- UK: BRC Shop Price Index
- Australia: RBA Governor Bullock Speaks
- Japan: BoJ Core CPI
- Spain: Unemployment Rate
- US: OPEC Meeting
- India: Industrial Production and Manufacturing Output
- Brazil: Mid-Month CPI
- US: ADP Employment Change
- US: Goods Trade Balance and Wholesale Inventories
- US: House Price Index and S&P/Case-Shiller Home Prices
- US: CB Consumer Confidence
- US: 7-Year Treasury Auction
- US: API Weekly Crude Oil Stock
Wednesday, July 29
- Australia: Q2 CPI, Trimmed Mean CPI and Monthly CPI Indicator
- UK: M4 Money Supply, Mortgage Approvals and Consumer Credit
- Germany: 10-Year Bund Auction
- US: Crude Oil, Gasoline and Distillate Inventories
- Russia: Retail Sales and Unemployment
- Canada: BoC Summary of Deliberations
- US: Fed Interest Rate Decision
- US: FOMC Statement and Press Conference
Thursday, July 30
- Japan: 2-Year and 30-Year JGB Auctions
- France: Q2 GDP and Consumer Spending
- Spain: Q2 GDP and CPI
- Germany: Q2 GDP
- Italy: Q2 GDP and Unemployment
- Eurozone: Q2 GDP and Unemployment
- UK: BoE Interest Rate Decision and MPC Minutes
- Germany: CPI and HICP
- US: Core PCE Price Index and PCE Price Index
- US: Q2 GDP and GDP Price Index
- US: Personal Income and Personal Spending
- US: Initial and Continuing Jobless Claims
- UK: BoE Governor Bailey Speaks
Friday, July 31
- Korea: Industrial Production and Retail Sales
- Japan: Tokyo CPI, Core CPI and Unemployment
- Japan: Industrial Production and Retail Sales
- China: Manufacturing, Non-Manufacturing and Composite PMIs
- Japan: BoJ Interest Rate Decision and Monetary Policy Statement
- France: CPI and HICP
- Germany: Unemployment
- Hong Kong: Q2 GDP
- Eurozone: CPI and Core CPI
- UK: BoE MPC Member Pill Speaks
- Canada: GDP
- US: Employment Cost Index
- US: Chicago PMI
- US: Michigan Consumer Sentiment and Consumer Expectations
- US: Michigan 1-Year and 5-Year Inflation Expectations
- US: CFTC S&P 500, Nasdaq 100, Gold, Crude Oil, Silver and Copper Positions
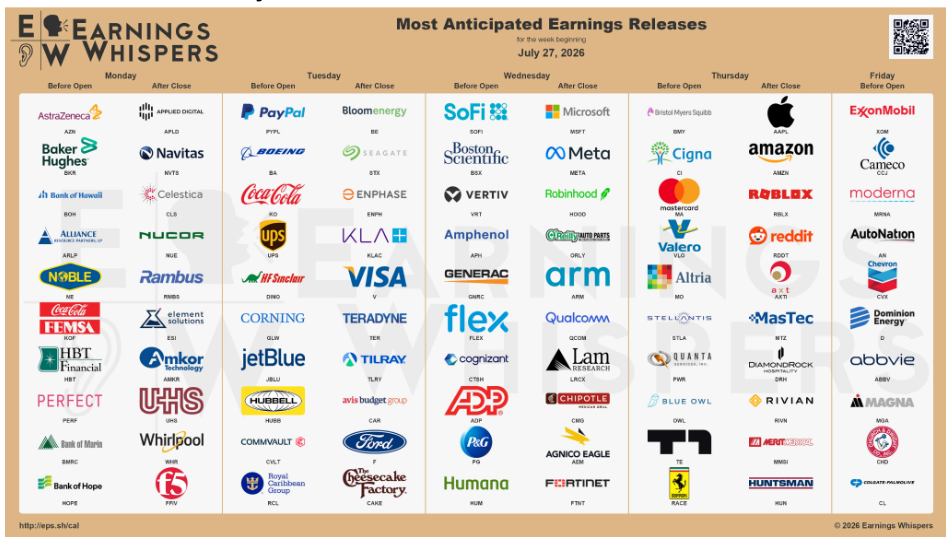
The week-ahead calendar from the pack, first chart.
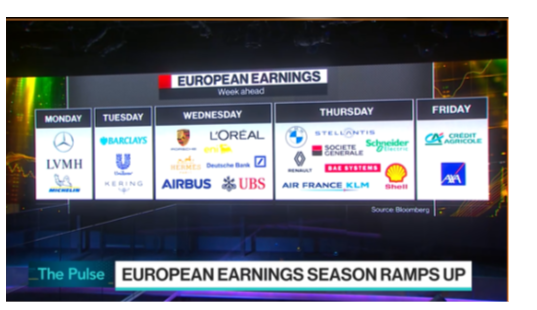
The week-ahead calendar from the pack, second chart.
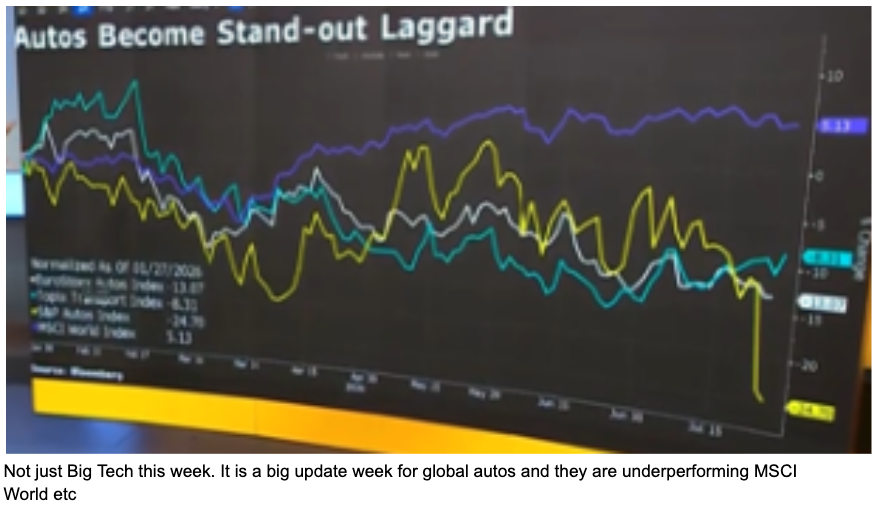
The week-ahead calendar from the pack, third chart.

The week-ahead calendar from the pack, fourth chart.
Takeaway
Markets enter the week with breadth, earnings and flows still providing support, but the tone has become more cautious. Oil, rates and AI-capex concerns now sit against a market where systematic positioning is elevated, and valuations leave less tolerance for disappointment.
Equities
The underlying structure remains constructive, with improving breadth and exceptional Q2 earnings. However, Tech selling by hedge funds, thinner gamma support and limited additional systematic buying mean forward guidance from this week's mega-cap reporters will be crucial.
Gold and silver
Gold is beginning to respond positively despite higher real yields after its largest correction of the current multi-year run. The report highlights tightening technicals, resilient physical demand and subdued positioning as reasons to watch whether gold begins catching up again.
Crypto
Crypto remains resilient, but ETF outflows are the immediate risk. The broader market is moving closer to buy territory, though continued outflows could leave gold relatively favoured in the short term.
Macro
Oil remains the key link between geopolitics, inflation and central-bank expectations. The Fed, BoE and BoJ all come into focus this week, while current bond and breakeven levels remain less extreme when viewed against pre-zero-rate history.
The market is not short of support, but much of it is already deployed. With earnings exceptionally strong, breadth holding and buybacks returning, the question is whether fundamentals can continue carrying the market through a more volatile seasonal period without oil, rates or AI spending becoming the catalyst that changes the balance. Trade carefully.

Closing chart from the July 27 pack.
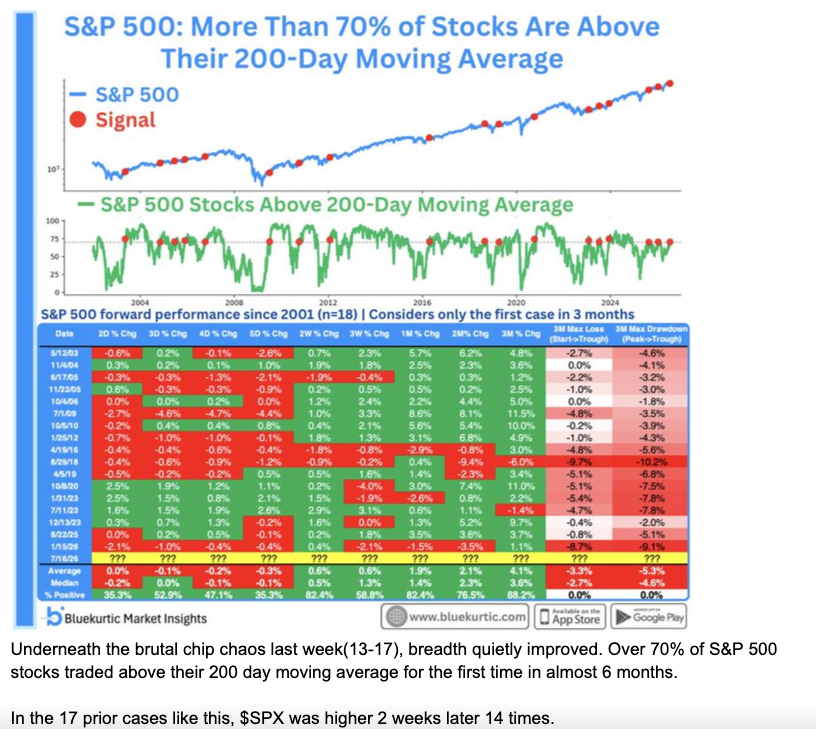
The two-sided equity tape at the end of the pack.
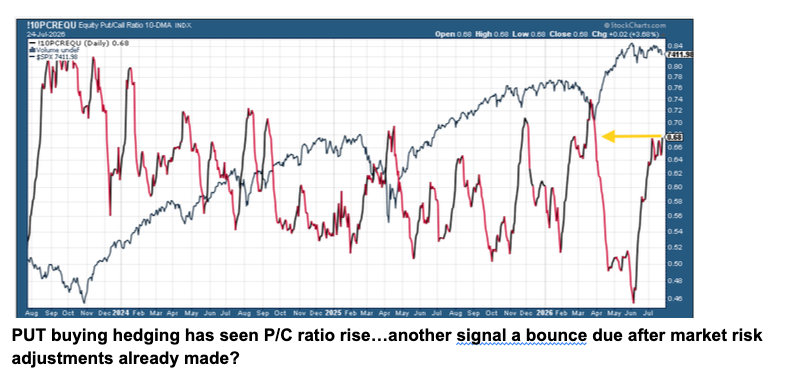
Sentiment and hedging at the close of the pack.
Charts and figures are from the 27 July 2026 weekly pack. This is a recap of that tape. It is not a personal recommendation, and nothing in it is guaranteed.