Introduction: Market on the Edge
Big moves are happening across global markets, and traders need to stay sharp. The U.S. economy has run into a wall, whether by design or sheer momentum, that’s the debate. Meanwhile, Europe is firing up its economic engines with massive defense and infrastructure spending, while China’s trade data signals deeper economic distress.
With a potential U.S. government shutdown looming, the Bank of Canada set to cut rates, and inflation data on deck, we’re in for a volatile week. Sentiment is at extreme levels, with hedge funds unloading stocks while retail traders scramble for downside protection. But as history tells us, these moments often mark inflection points.
Key Market Themes
U.S. Growth Stalls, Recession Debate Heats Up
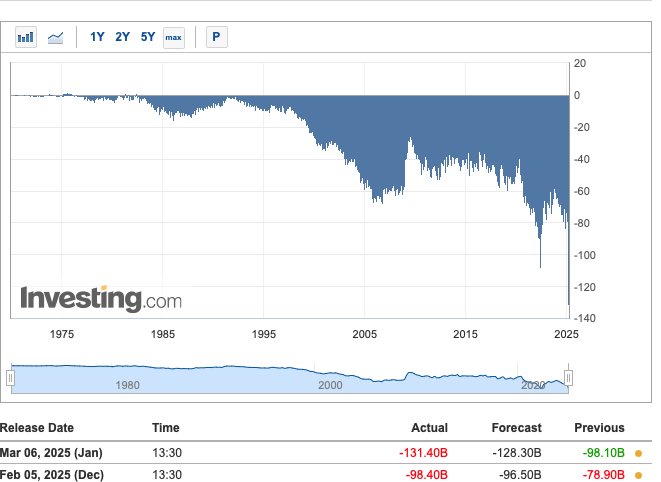
The U.S. economy is flashing red, with Goldman Sachs cutting 2025 GDP growth forecasts to 1.7% (Q4/Q4) from 2.2%. The Atlanta Fed’s GDPNow model has plunged into negative territory, now forecasting a -2.4% GDP contraction for Q1. This is a major shift from previous expectations and could force the Fed’s hand sooner than expected.
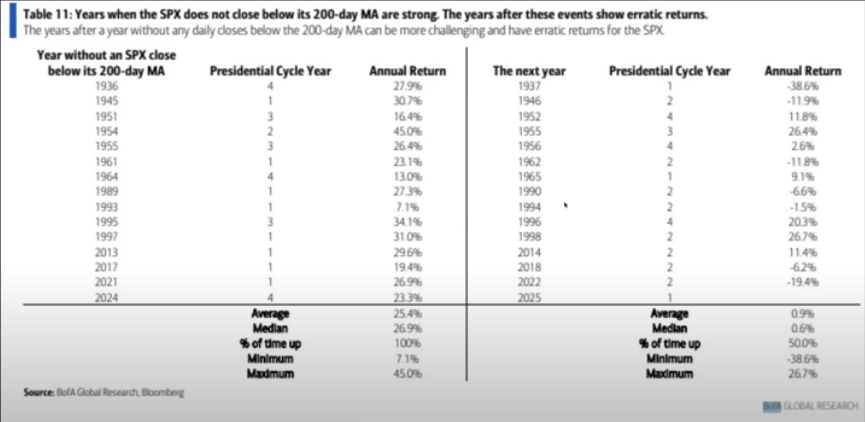
JPMorgan strategists suggest that 90% of the current selloff is behind us, but with U.S. equities closing below their 200-day moving averages, the next two weeks are crucial. Will economic weakness be the catalyst for rate cuts, or are we entering a deeper slowdown?
European Markets Surge: Can the Rally Last?
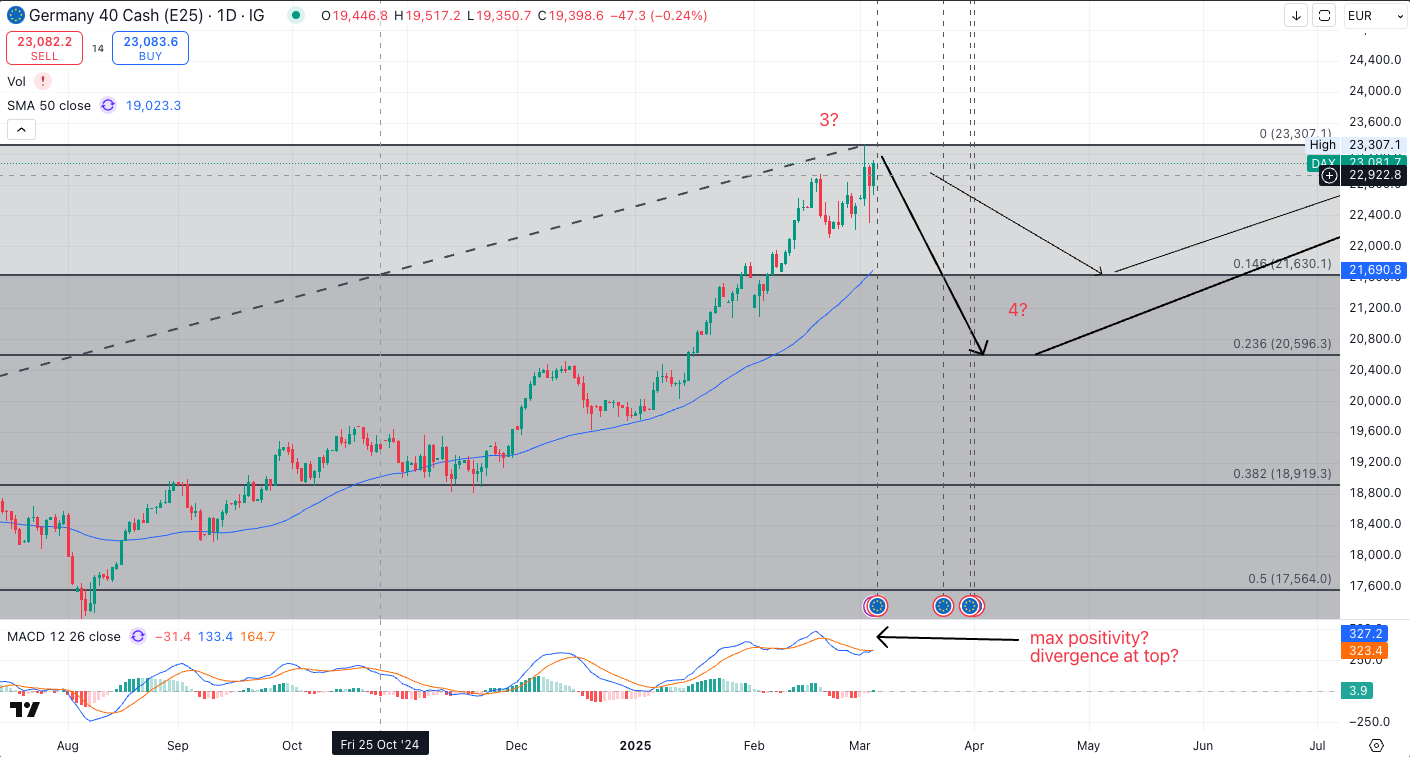
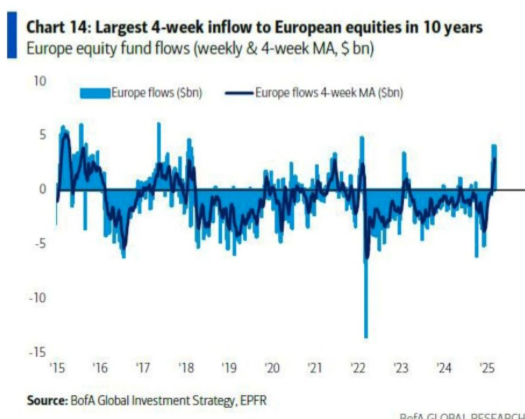
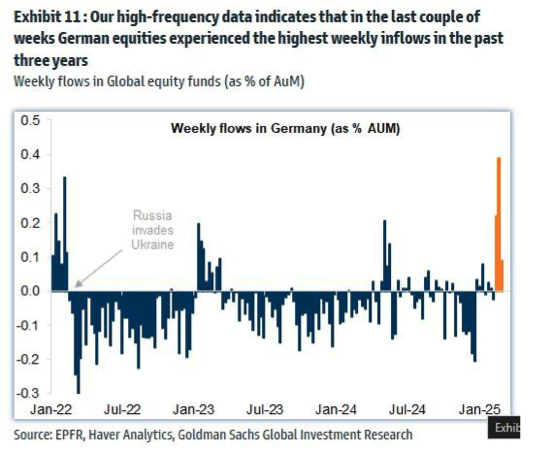
While U.S. markets falter, European equities continue to outperform. Capital flows are shifting into defense, infrastructure, and industrials following a European Summit that signaled record government spending. Germany has taken the lead, unleashing €500bn in industrial stimulus, plus an €800bn defense package, the largest since reunification.
But will this spending spree lead to a true Euro-bond issuance, or simply ignite another inflationary spiral? For now, investors are piling into European equities, with the DAX outperforming the S&P 500 by over 5% YTD.
China’s Economy in Distress, Stimulus Incoming?
China’s trade data and inflation numbers paint a grim picture. Exports remain weak, imports are collapsing, and deflation is deepening, while the consumer price index (CPI) fell at its sharpest pace in 13 months, and producer price deflation has now extended for a 30th straight month.
With Beijing now committing to a 4% fiscal deficit target, expectations for stimulus are growing. The Chinese tech sector has become a major battleground in the AI race, with Beijing doubling down on semiconductor support. If China unleashes broad-based stimulus, expect a risk-on rally in metals, commodities, and tech.

Technical & Sentiment Analysis
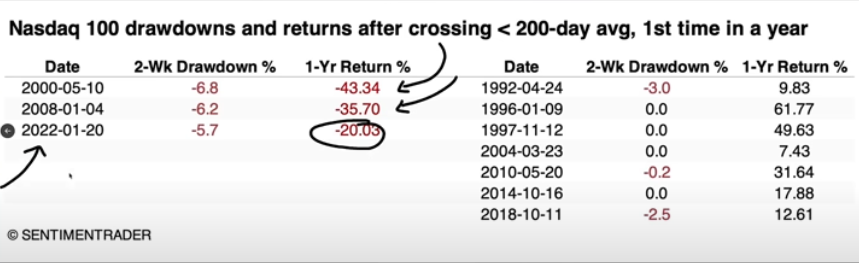
NASDAQ 100 Crashes Through 200-Day Moving Average
A brutal -10% drop took the NASDAQ through its 200DMA, triggering widespread panic selling. However, Broadcom’s blowout earnings helped the index recover off Friday’s lows, raising the question, was this the bottom?
Historically, when sentiment reaches extreme bearish levels, a reversal is often near. But the next two weeks are critical, if NASDAQ falls another 3.5% below its 200DMA, the downtrend could accelerate hard.
Hedge Funds and Retail Investors Dump Stocks
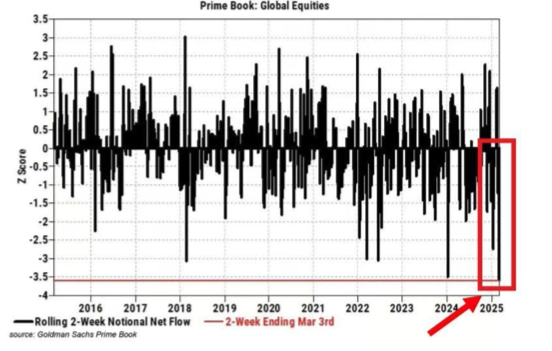
Hedge funds have been dumping stocks at the fastest pace in years, while retail investors have rushed into record-high put buying. This extreme level of downside protection is often a contrarian bullish signal, but is it different this time?
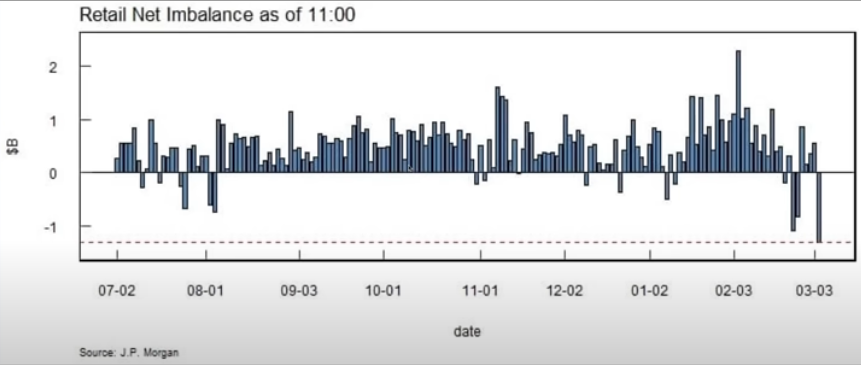
SPX & Dow Holding on for Dear Life
The S&P 500 and Dow Jones are teetering on the edge. While NASDAQ has already hit a -10% correction, SPX and Dow have not yet breached their key support levels. If these indices break below their 200DMAs, further downside could be swift.
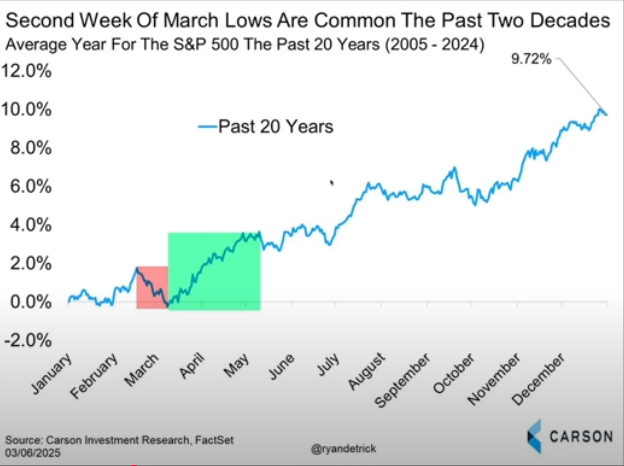
Last Week’s Recap
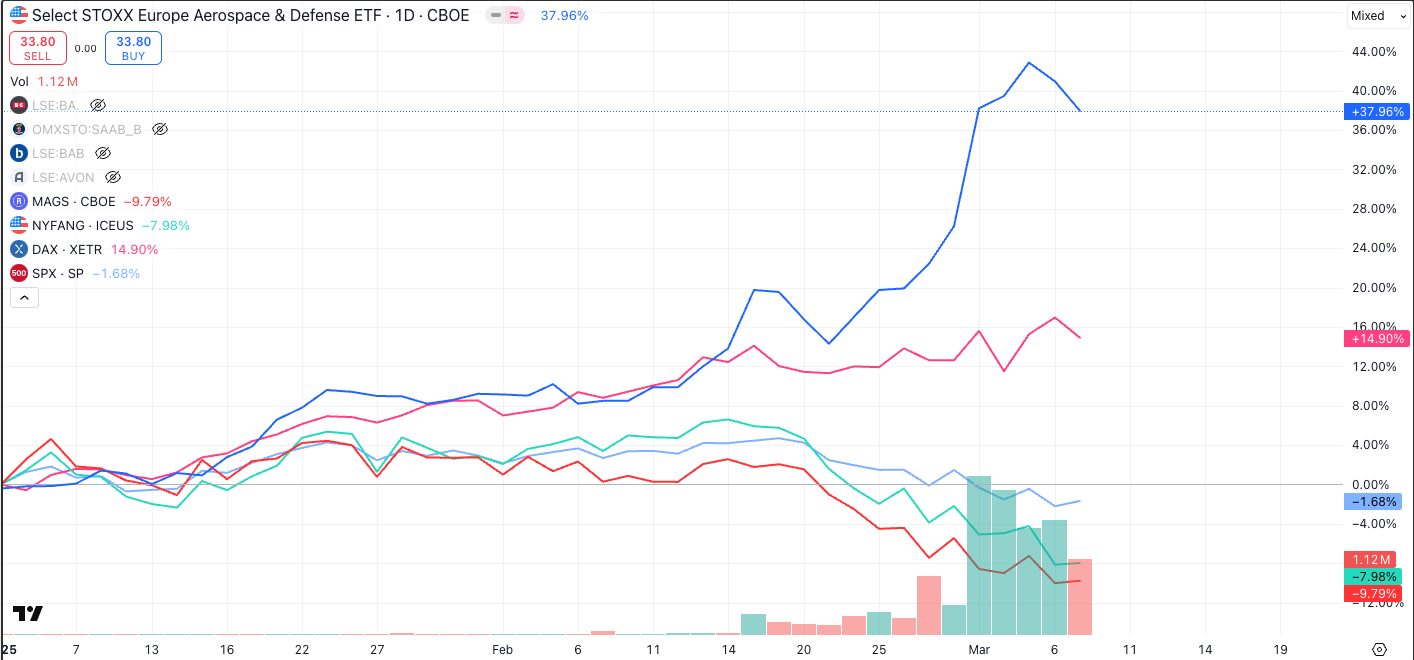
Defense Stocks Surged
On massive European spending, but inflation concerns triggered some profit-taking.
Gold Rallied Hard
With inflows into safe havens accelerating.
U.S. Payrolls Disappointed
With the unemployment rate ticking up to 4.1%.
German Bond Yields Jumped 40bps
Marking their sharpest move since 1990.
Week Ahead: Key Events & Earnings
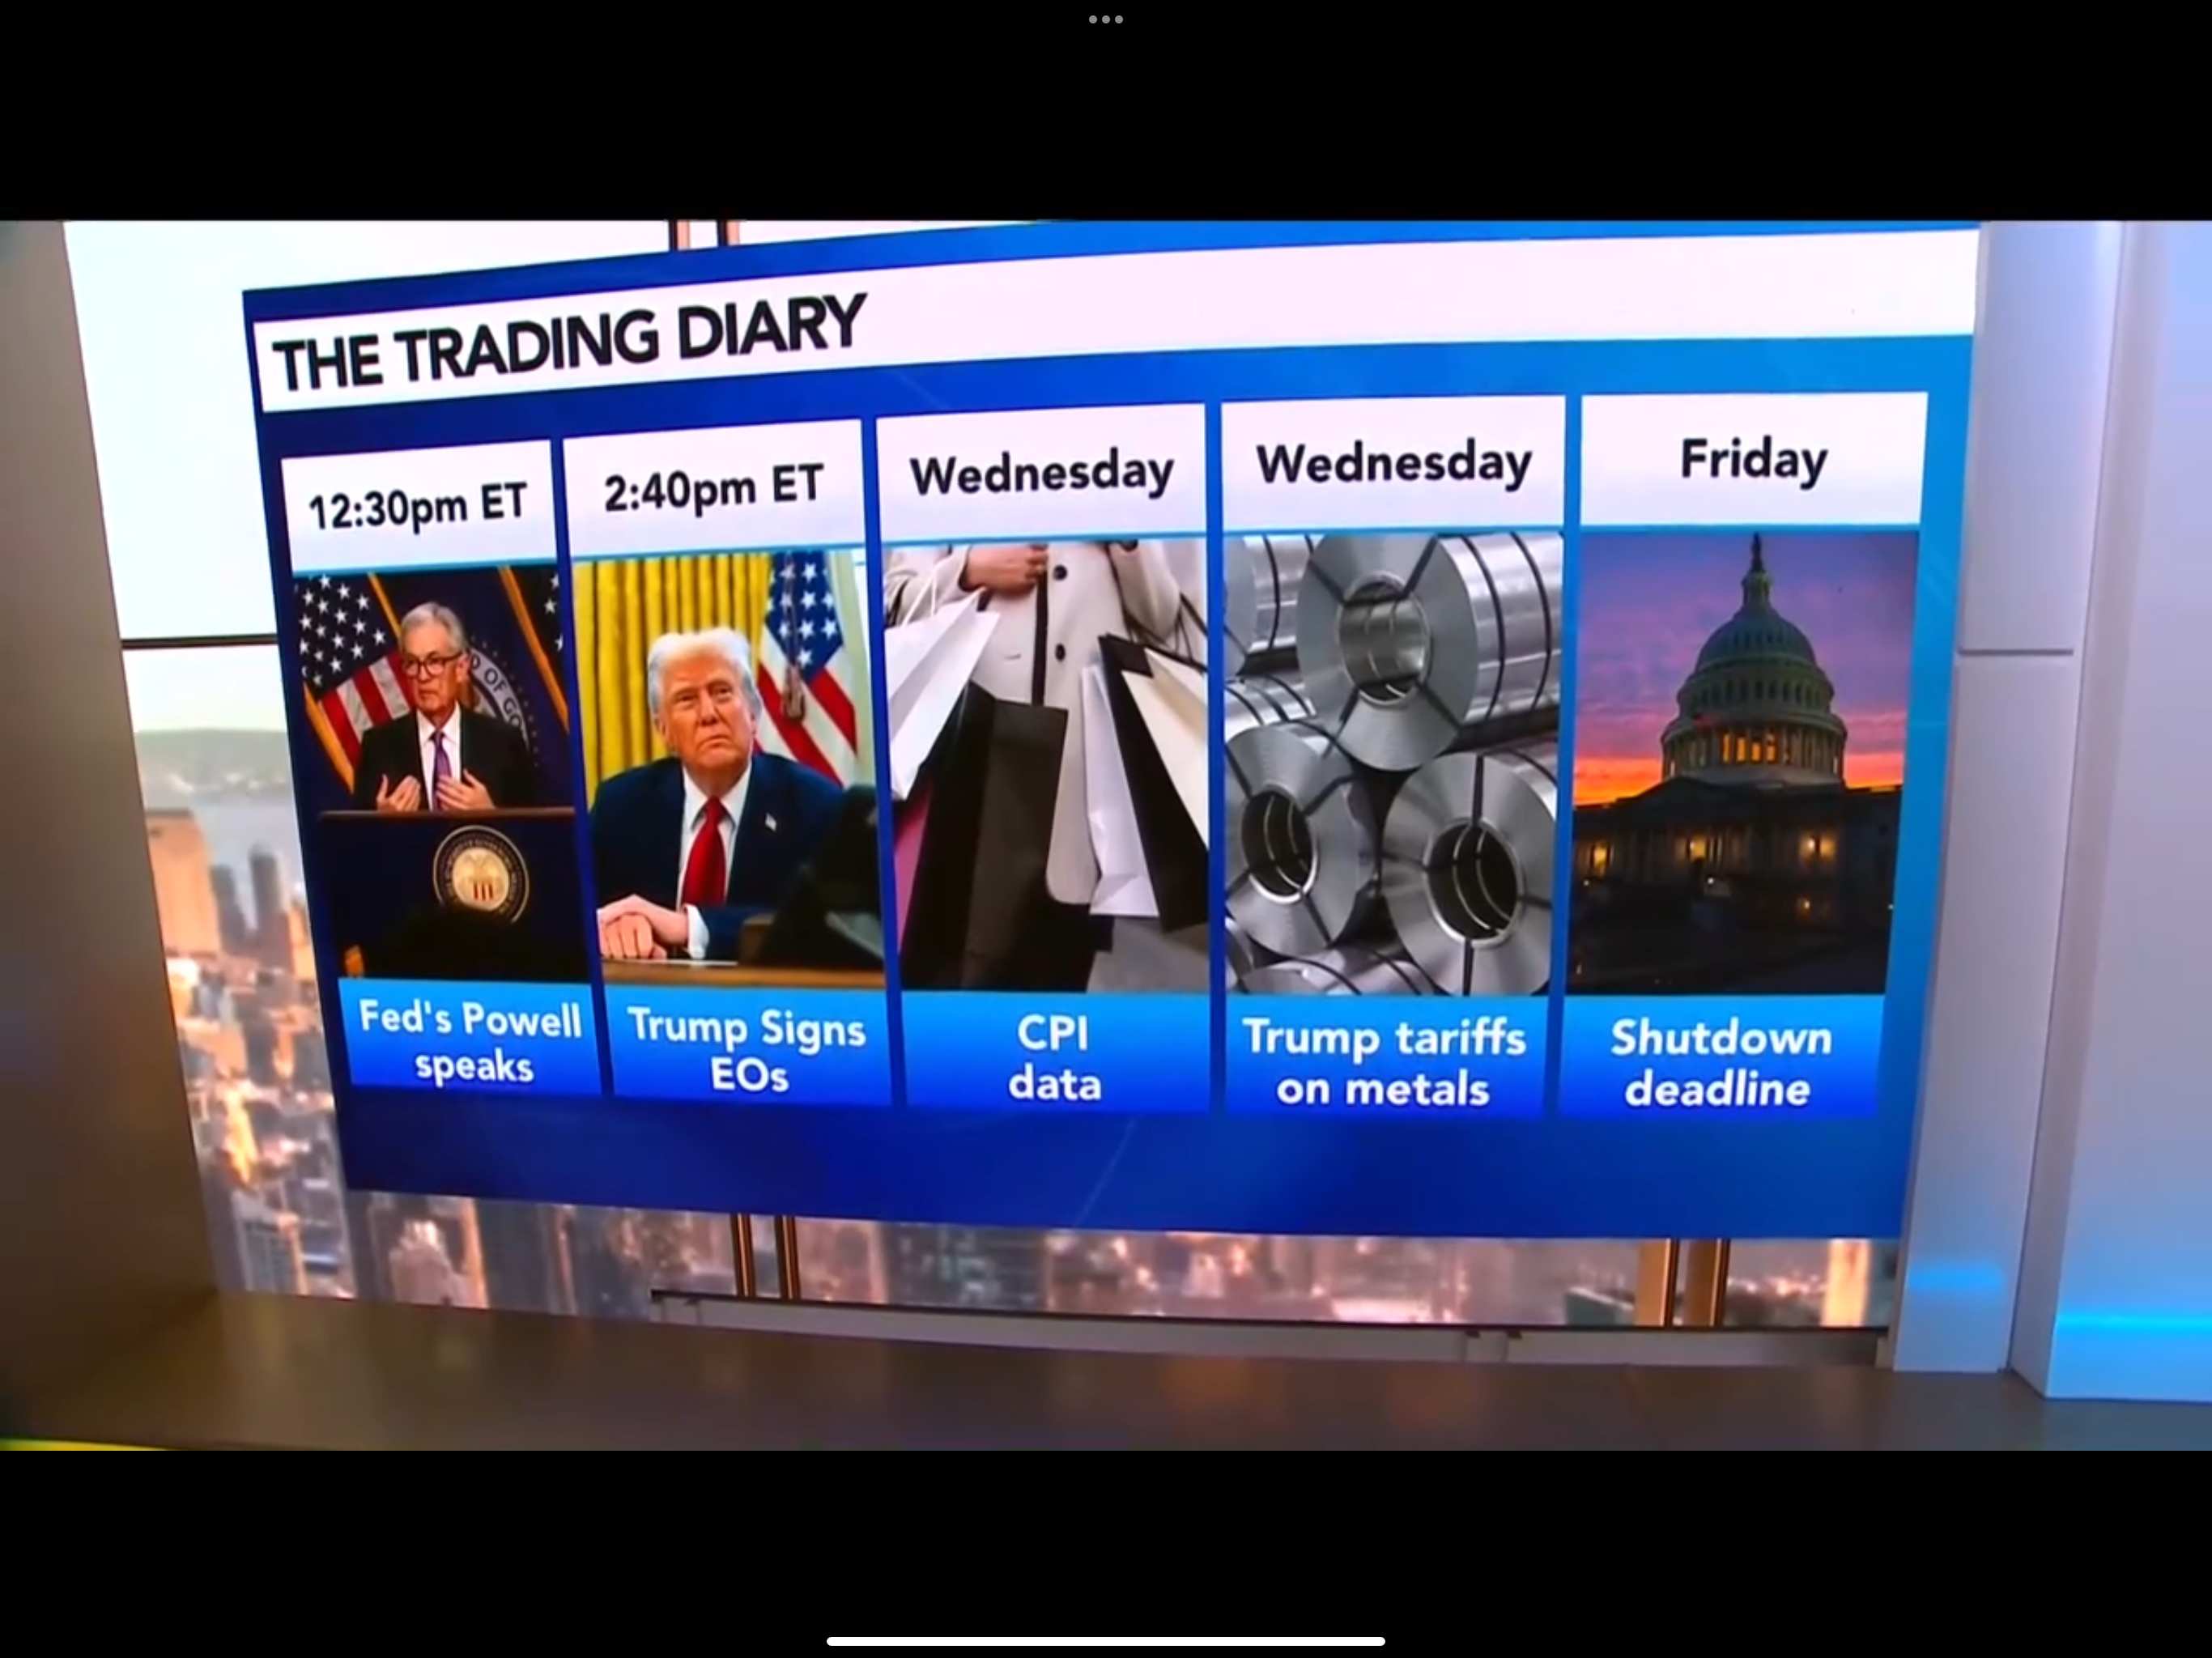
Monday
CNY CPI (Deflation Alarm), NY Fed Inflation Expectations
Tuesday
U.S. JOLTS, Oil EIA Short-Term Outlook, Volkswagen Earnings
Wednesday
U.S. CPI, Bank of Canada Rate Decision, Metals tariffs, Adobe & Inditex Earnings
Thursday
ECB Speakers, U.S. PPI & Initial Claims
Friday
U.S. Michigan Consumer Confidence, U.K. GDP
Actionable Takeaways
Europe Is Outperforming
Keep an eye on defense and infrastructure plays.
China Stimulus Is Incoming
Watch for a rally in metals, commodities, and tech.
NASDAQ Near a Bottom?
Extreme bearish sentiment often signals a reversal.
SPX 200DMA Is Key
A break below could trigger another leg lower.
Key Trades to Watch
Long European Defense Stocks
The spending spree is real.
Short U.S. Dollar (DXY)
The Fed is increasingly likely to cut rates.
Long Gold (XAU/USD)
Safe-haven demand remains strong.
Short U.S. Regional Banks (KRE ETF)
The economic slowdown is starting to show cracks in the financial sector.
Final Thoughts
The market is at a crossroads. Extreme fear and technical breakdowns suggest further downside risk, but capitulation signals and record hedge fund selling hint at a potential bottom. Keep an eye on key technical levels and capital flows, March could be the pivot month that defines 2025.
Trade smart, and stay nimble!