Setting the Stage: Markets React to Policy Shifts & Economic Cooling
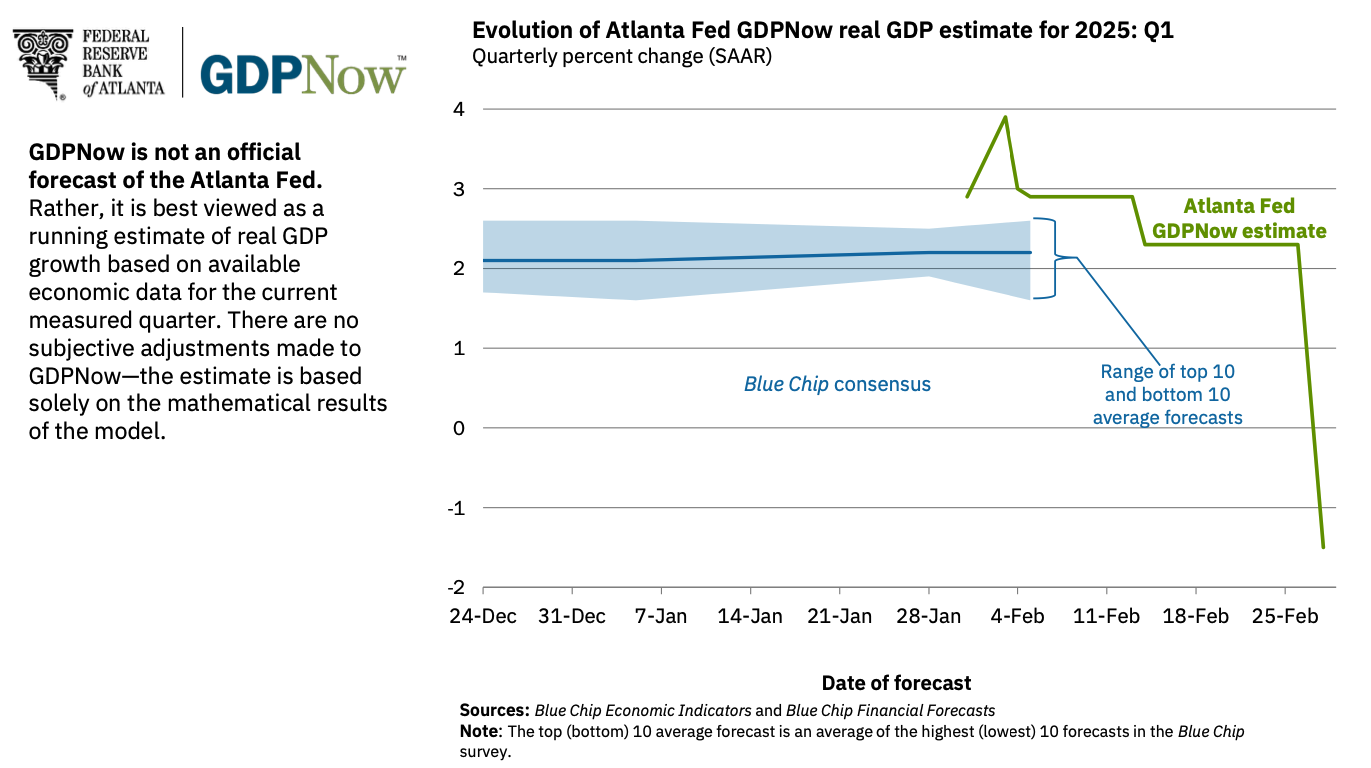
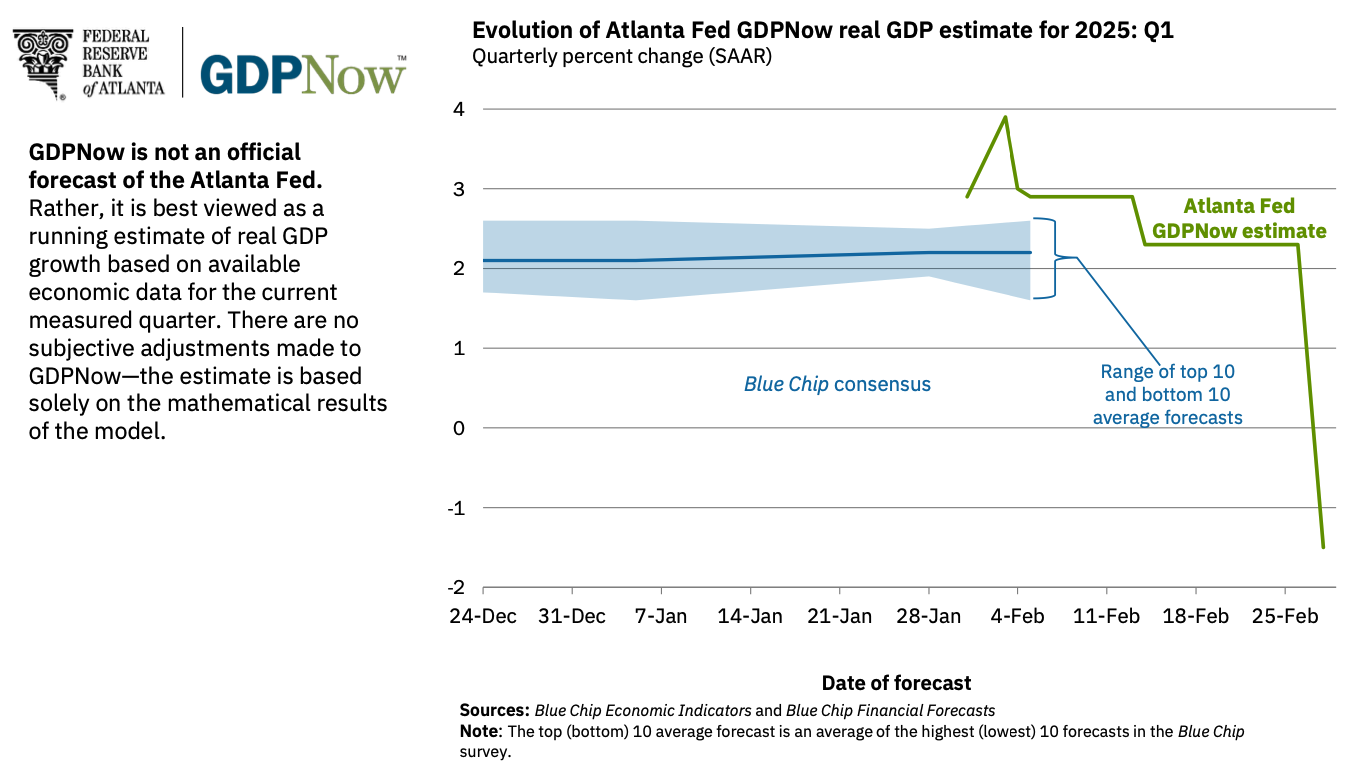
As Q1 unfolds, market volatility is picking up, driven by weakening economic data and shifting policy expectations. The latest AtlantaFed GDPNow estimate plummeted to (-1.5%) from a high of 3.9% just weeks ago, signalling a sharp economic slowdown. This shift has traders recalibrating rate-cut expectations, with the Fed’s dual mandate, employment and inflation, returning to focus.
The major indices are at key technical levels, with dip buyers on edge. The Nasdaq 100 (NAS100) is testing the 200-day moving average (DMA) after a 10% pullback, raising the question: has the low already been set, or is a deeper correction looming?
Key Market Themes
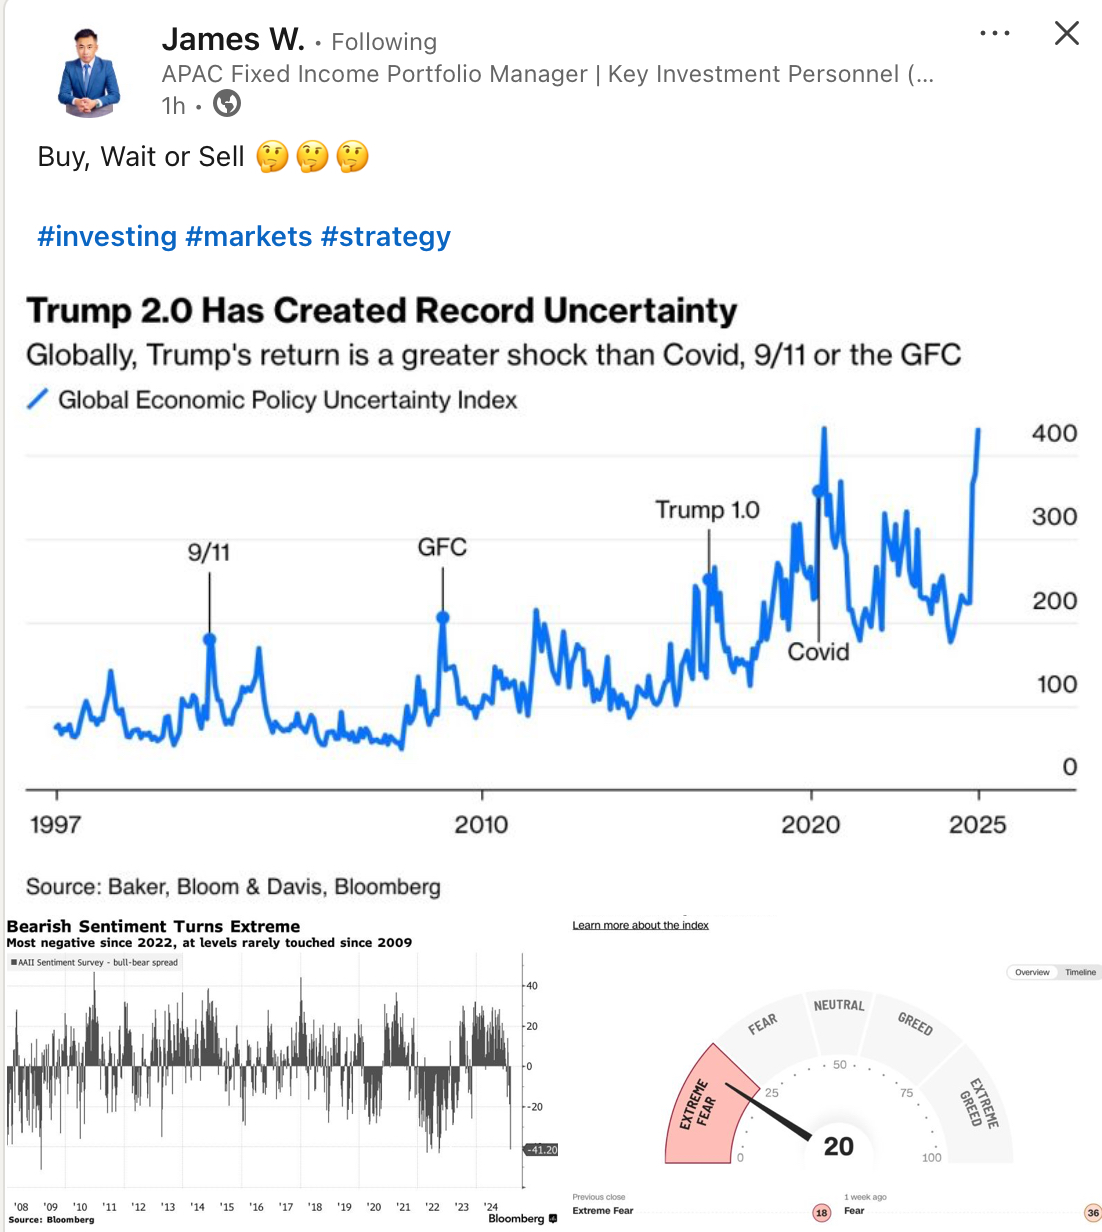
U.S. Economic Slowdown: Recession on the Horizon?
The collapse in consumer confidence and weak retail sales are setting up a stagflation narrative. If GDP trends are negative in Q1, the Fed may have no choice but to accelerate rate cuts. Will Powell hold the line, or will political pressure push the Fed to act sooner?
Bond Market Signals: Rate Cuts Incoming?
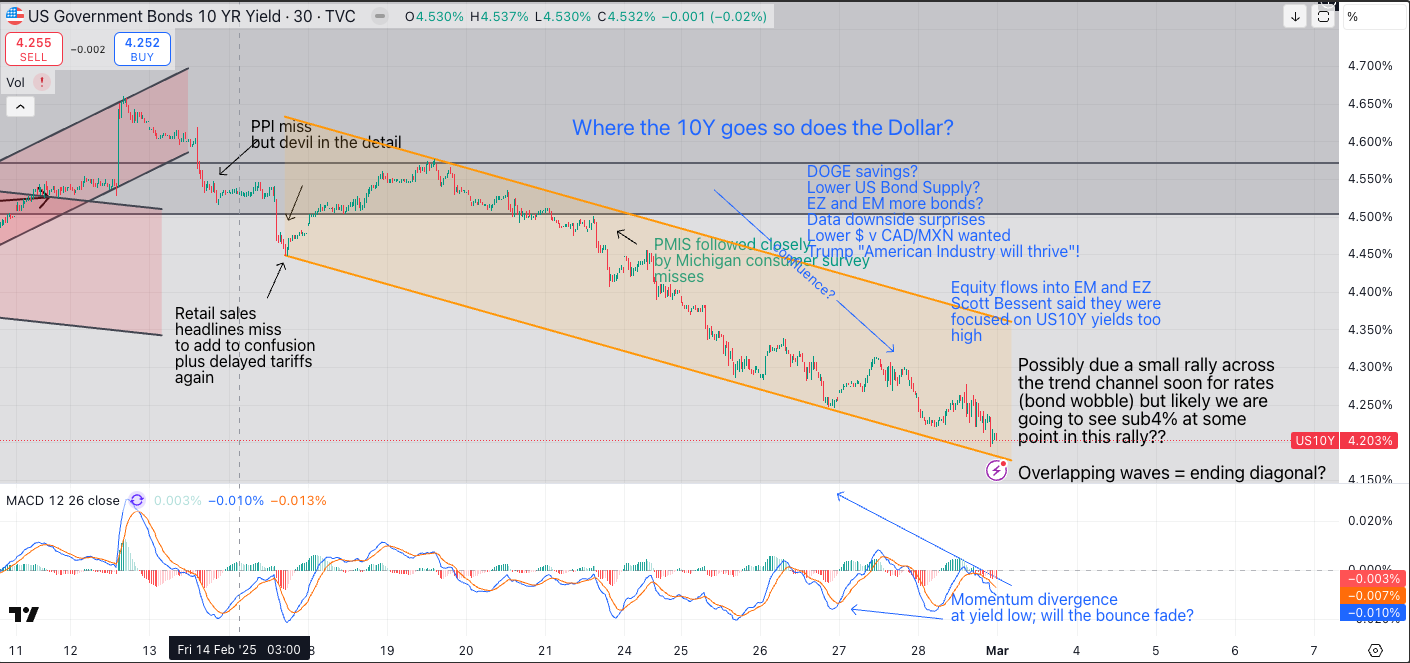
Bond markets are pricing in 3 to 4 rate cuts in 2025, with the US10Y yield now grinding lower. However, inflation data remains sticky, creating a push-pull dynamic that could keep the Fed cautious. Keep an eye on the yield curve and real rates, any steepening could signal recession fears taking over.
Equity Markets: Dip-Buying or Breakdown?
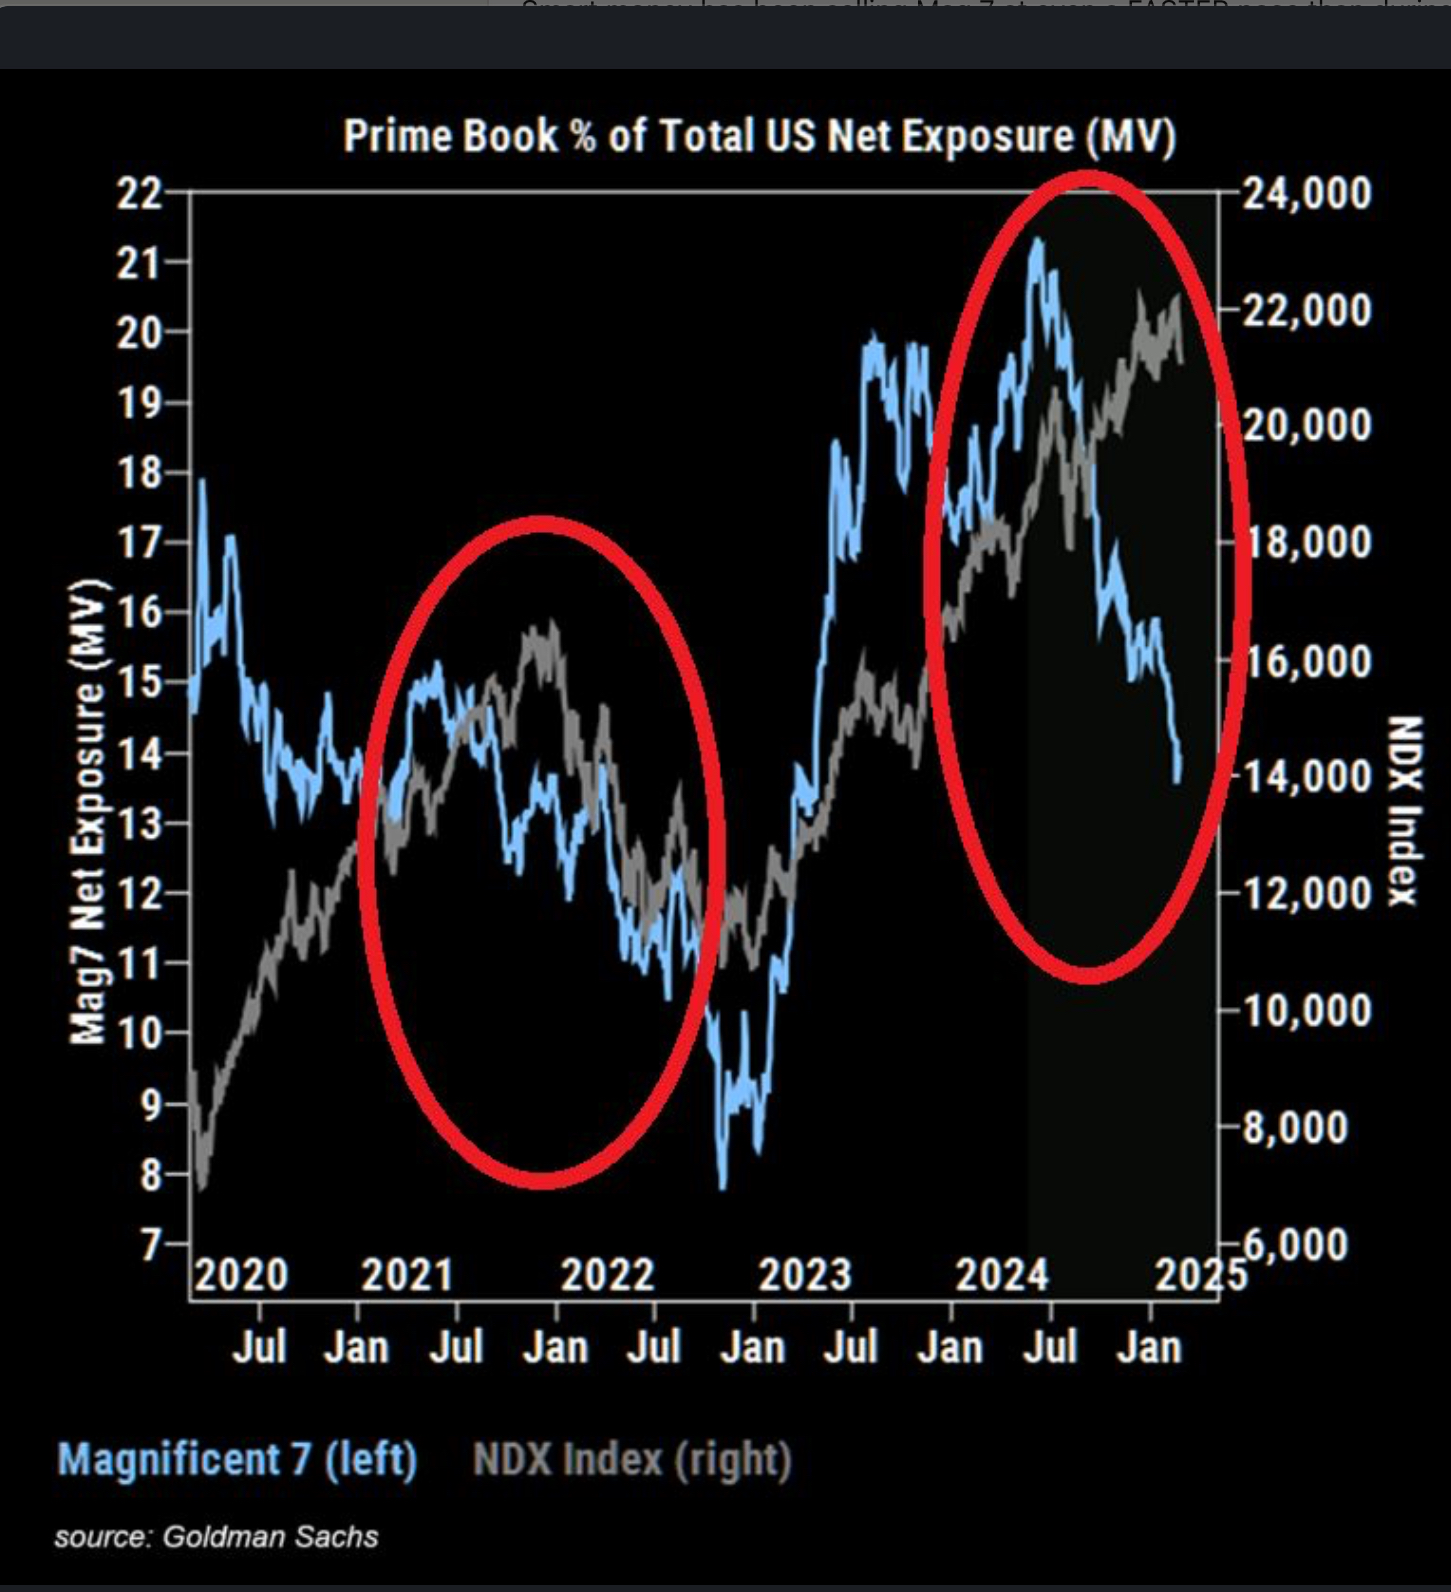
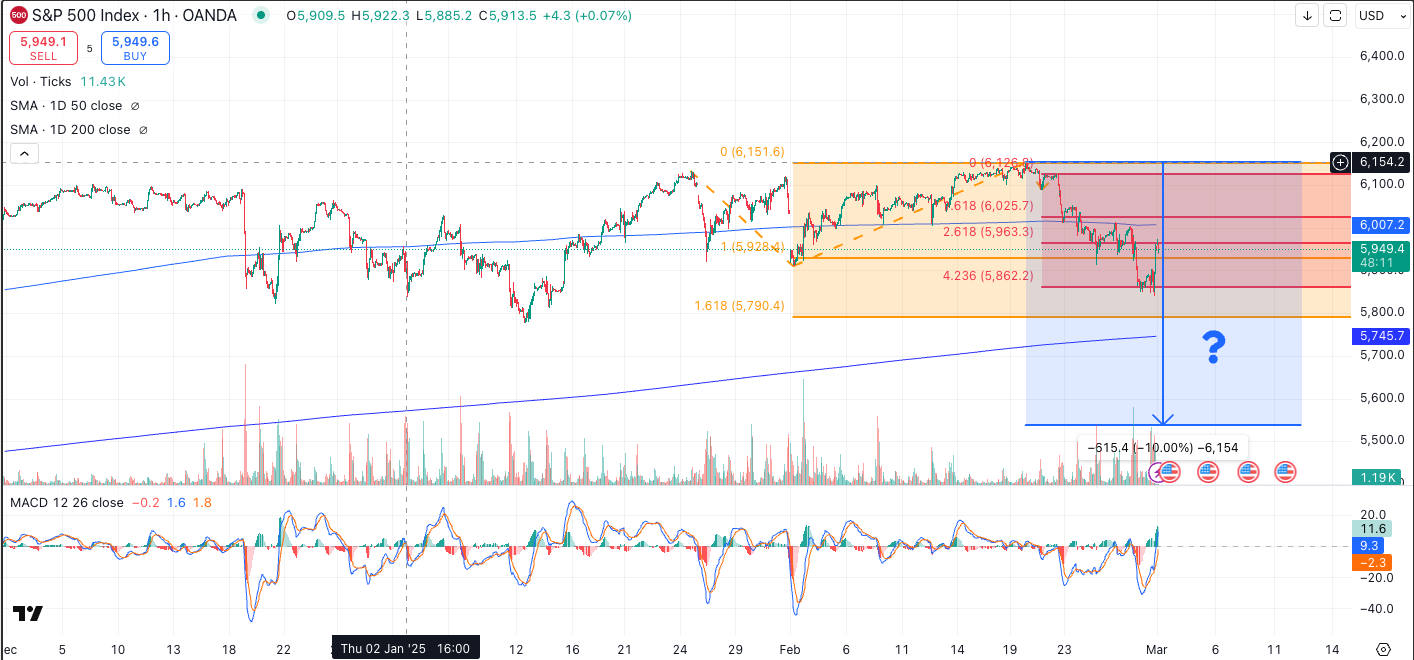
Major indices have pulled back, with the S&P 500 holding key support, while small caps (Russell 2000) continue to struggle. Hedge fund positioning shows a rotation out of the “Magnificent 7” into equal-weight indices. Is this the early sign of a broader correction or a sectoral reset?
Global Macro Shifts: Europe & China
Europe’s Peace Dividend?
Poland is outperforming as rebuilding efforts post-Ukraine truce pick up steam. However, with Trump threatening 25% tariffs on EU imports, European markets could soon face headwinds.
China Stimulus Watch
The National People's Congress (March 6) could unveil fresh fiscal stimulus. Markets will react sharply to any signs of economic lifelines being extended.
Technical & Sentiment Analysis
Equities
Holding key levels, but sentiment remains fragile.
Bonds
Rate cut expectations rising, yet inflation remains a concern.
Commodities
Gold testing ATHs, oil facing supply-demand uncertainties.
Crypto
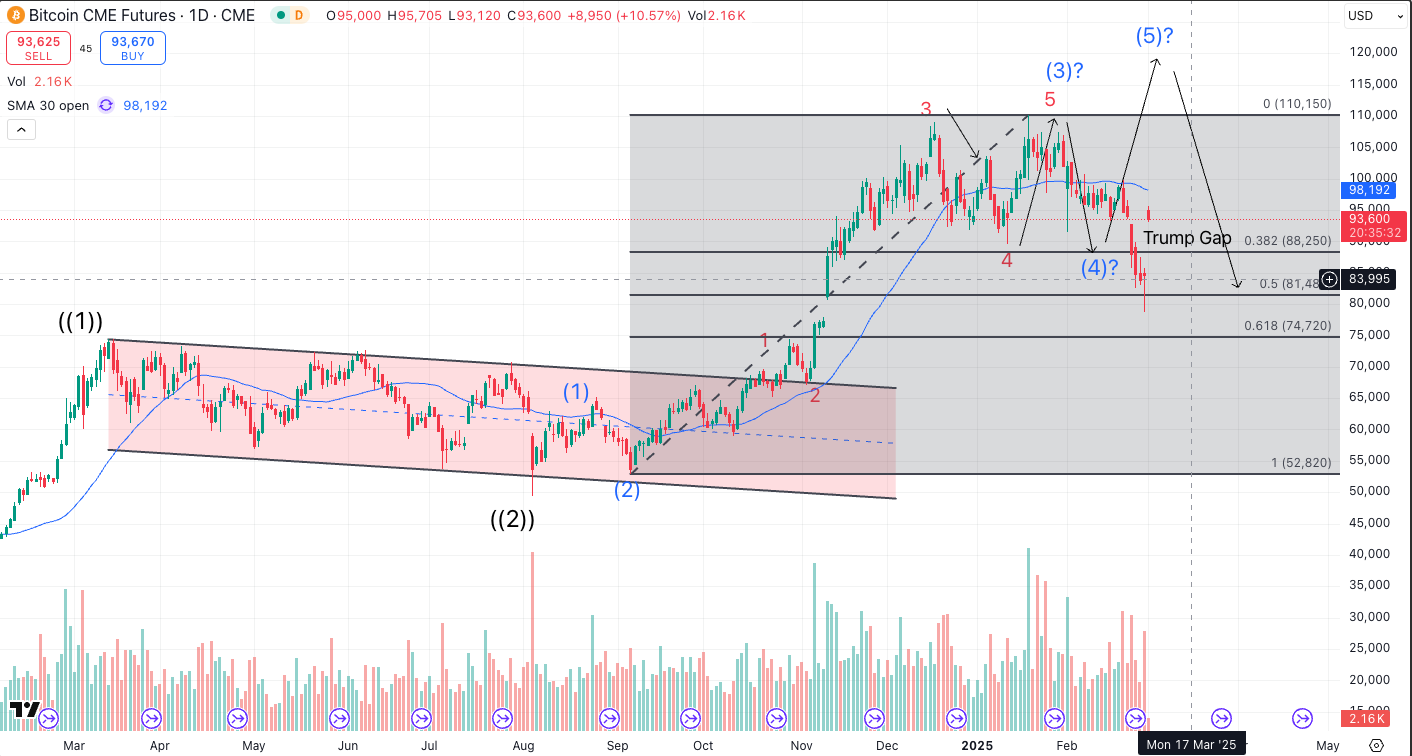
Bitcoin rebounded on Trump’s crypto reserve comments, will it sustain?
Last Week’s Recap: Key Events & Earnings
AtlantaFed GDPNow Collapses
Real-time GDP estimates show Q1 contraction.
Trump’s Tariff Threats
25% tariffs on EU autos and other goods, a major escalation in trade tensions.
Hedge Funds Dumping Big Tech
Mag7 seeing sharp outflows as institutions rotate into equal-weight strategies.
Nvidia Sell-Off
Biggest post-earnings drop in a year despite strong numbers, reflecting a shift in market sentiment.
The Week Ahead: Key Market Events
Monday (March 3)
Global Manufacturing PMIs and ISM Manufacturing plus EZ CPI, key drivers for rate cuts historically.
Tuesday (March 4)
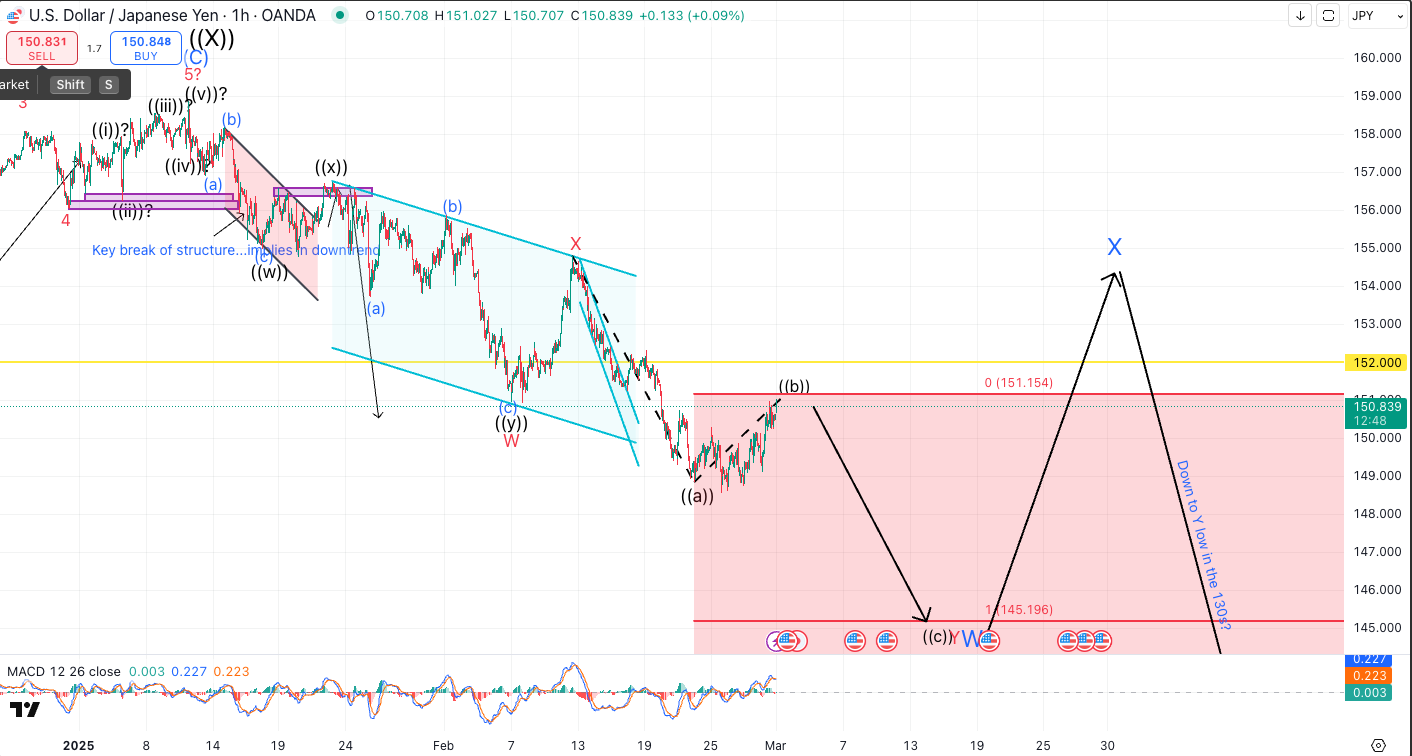
BOJ chief Ueda updates, Yen seems a one-way bet?
Wednesday (March 5)
China National People’s Congress. Will the stimulus be enough to match the rally so far?
Global Services PMIs and U.S. ISM Services PMI. A key indicator of economic resilience.
Thursday (March 6)
ECB Rate Decision. Enough concerns for 25bp this week, but will they go big and cut 50bp instead?
Friday (March 7)
U.S. Jobs Report (NFP). A pivotal report for Fed rate expectations with Powell speaking later in the day.
Actionable Takeaways
Rates & Recession Risks
If data continues to weaken, the Fed will be under pressure to cut faster, watch bond yield movements.
Equity Market Inflection
The next move hinges on upcoming economic reports and Powell’s response.
Gold & Safe Havens
Gold is on the verge of another breakout, geopolitical risks could accelerate this move.
Crypto’s Wildcard
Trump’s comments reignited speculation, will regulatory clarity push Bitcoin higher?
Key Trades to Watch
Long Gold
If inflation fears persist and central banks remain dovish, gold could see another rally.
Short Small Caps (IWM)
The Russell 2000 is lagging, momentum remains weak.
Watch EUR/USD
Trade war rhetoric and ECB decisions could drive volatility.
Bitcoin Upside?
If the “Trump Crypto Reserve” narrative gains traction, BTC could push higher.
Markets are in a fragile state, position wisely and stay nimble.