Quick answer: The head and shoulders pattern is a chart pattern that can signal a trend reversal. After an uptrend, price makes three peaks: a left shoulder, a higher head and a lower right shoulder, joined at the bottom by a line called the neckline. A close below the neckline suggests the uptrend may be ending. The upside-down version, the inverse head and shoulders, can signal the end of a downtrend.
What is the head and shoulders pattern? It is one of the best-known reversal patterns in technical analysis. It shows buyers pushing price to a new high (the head), then failing to repeat it (the right shoulder). When price then breaks the support that held during the pattern, many traders read it as a sign that control has passed from buyers to sellers.
This guide covers how to spot it, how traders frame entries, stops and targets, the inverse version, why it fails, and how it fits Alpha Capital's rules.
Risk note: This is an explanation of how a chart pattern works, not advice to trade it. No pattern predicts price with certainty, and trading forex and CFDs carries a high level of risk. All Alpha Capital accounts are simulated accounts with simulated funds. Performance fees are performance-based, and outcomes are not guaranteed.
Key facts about the head and shoulders pattern
| Question | Short answer |
|---|---|
| What is it? | A reversal pattern with three peaks: left shoulder, head, right shoulder |
| Where does it form? | At the end of an uptrend (the inverse version forms after a downtrend) |
| Key level | The neckline, drawn through the two lows between the peaks |
| Confirmation | A candle that closes beyond the neckline, not just a touch |
| Common stop placement | Beyond the right shoulder |
| Measured-move target | The height from head to neckline, projected from the breakout |
| Is it reliable? | It is a probability, not a certainty; many patterns fail or never confirm |
What does the head and shoulders pattern look like?
The pattern has five parts, and each one tells part of the story:
- Left shoulder: in an existing uptrend, price rallies to a peak and pulls back.
- Head: price rallies again to a higher peak, then falls back to around the level of the first pullback.
- Right shoulder: a third rally fails to reach the head and turns lower. This lower high is the first sign that buyers are weakening.
- Neckline: a line drawn through the two lows between the shoulders and the head. It acts as support while the pattern forms.
- Breakout: price closes below the neckline. Until that happens, the pattern is only a possibility.
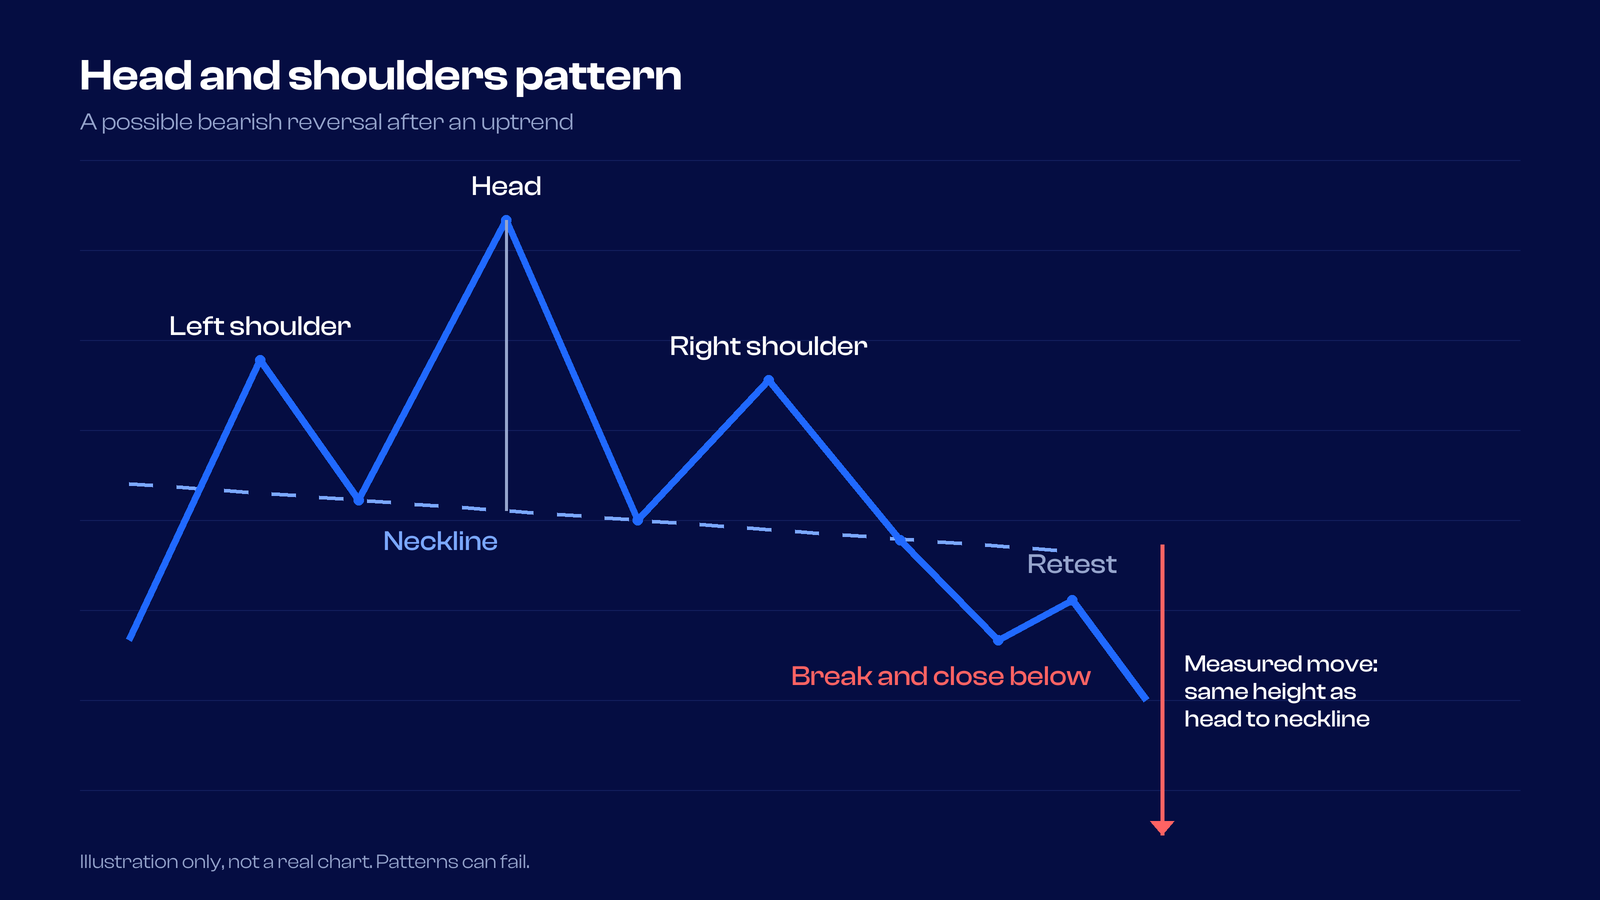
Real charts are rarely as neat as a diagram. What matters is the sequence: a higher high, then a lower high, then a break of support.
How do you spot a head and shoulders pattern on a chart?
Start with the trend
A reversal pattern needs something to reverse. Look for a clear uptrend, with higher highs and higher lows, before the left shoulder. Three bumps in a sideways range carry much less meaning.
Find the three peaks
The head should stand clearly above both shoulders, and the right shoulder is usually close in height to the left one. Shoulders that look very different make the pattern harder to read.
Draw the neckline, including sloped necklines
Connect the low after the left shoulder with the low after the head. The line can be flat, rising or falling. A neckline that slopes down is often seen as the weaker-looking, more bearish version, because buyers could not even hold the earlier low. A neckline that slopes up can still work, but price has further to fall before it breaks, so the signal arrives later. Extend the line to the right: that is the level price has to close beyond.
The break of the neckline is closely related to a break of structure: price takes out a swing low that held during the uptrend, which is one way traders judge that the trend has changed.
What role does volume play?
In the classic description, volume is strong on the left shoulder and lighter on each later rally, a sign that buying interest is fading. It often picks up when price breaks the neckline, as stops are hit and new sellers join.
In spot forex, chart volume is usually tick volume (the number of price changes, not the amount traded), so treat it as a rough guide, not proof.
How is a head and shoulders pattern confirmed?
Most traders wait for a candle to close beyond the neckline on the timeframe they are trading. A brief move through the line that snaps back before the close is common, and it is one of the main ways the pattern traps traders who act early.
After the break, price often comes back to test the neckline from the other side. In a bearish pattern, the old support can act as resistance. This is called a retest. Some traders look for the retest before they consider the pattern confirmed; others act on the first close. A retest is not guaranteed: in a fast market, price may never come back.
How do traders frame entries, stops and targets?
The pattern gives traders three reference points. The descriptions below explain how the method is usually framed. They are not a recommendation to trade it.
Entry
Some traders act on the first close beyond the neckline, which catches moves that never retest but gives more false signals. Others wait for a retest that holds, which filters out some failures but misses moves that never come back.
Stop placement
A stop loss is often placed beyond the right shoulder, because a move above it would undo the lower high that defines the pattern. A more conservative option is beyond the head, which gives the trade more room but means a bigger loss if it fails. Whatever the method, the position size is usually set so that the distance to the stop equals the amount the trader is prepared to lose.
The measured-move target
The traditional target is the measured move. Measure the vertical distance from the top of the head to the neckline directly below it, then project that distance from the point where price broke the neckline. For example, if the head is 120 pips above the neckline, the measured move points to a level about 120 pips below the breakout.
The measured move is a guide, not a promise: price can stop short at an earlier support level or travel much further.
What is an inverse head and shoulders pattern?
The inverse head and shoulders is the same pattern upside down. It forms after a downtrend and can signal a bullish reversal. Price makes a low (left shoulder), a lower low (head) and a higher low (right shoulder), and the neckline runs through the two highs between them. A close above the neckline is the confirmation.
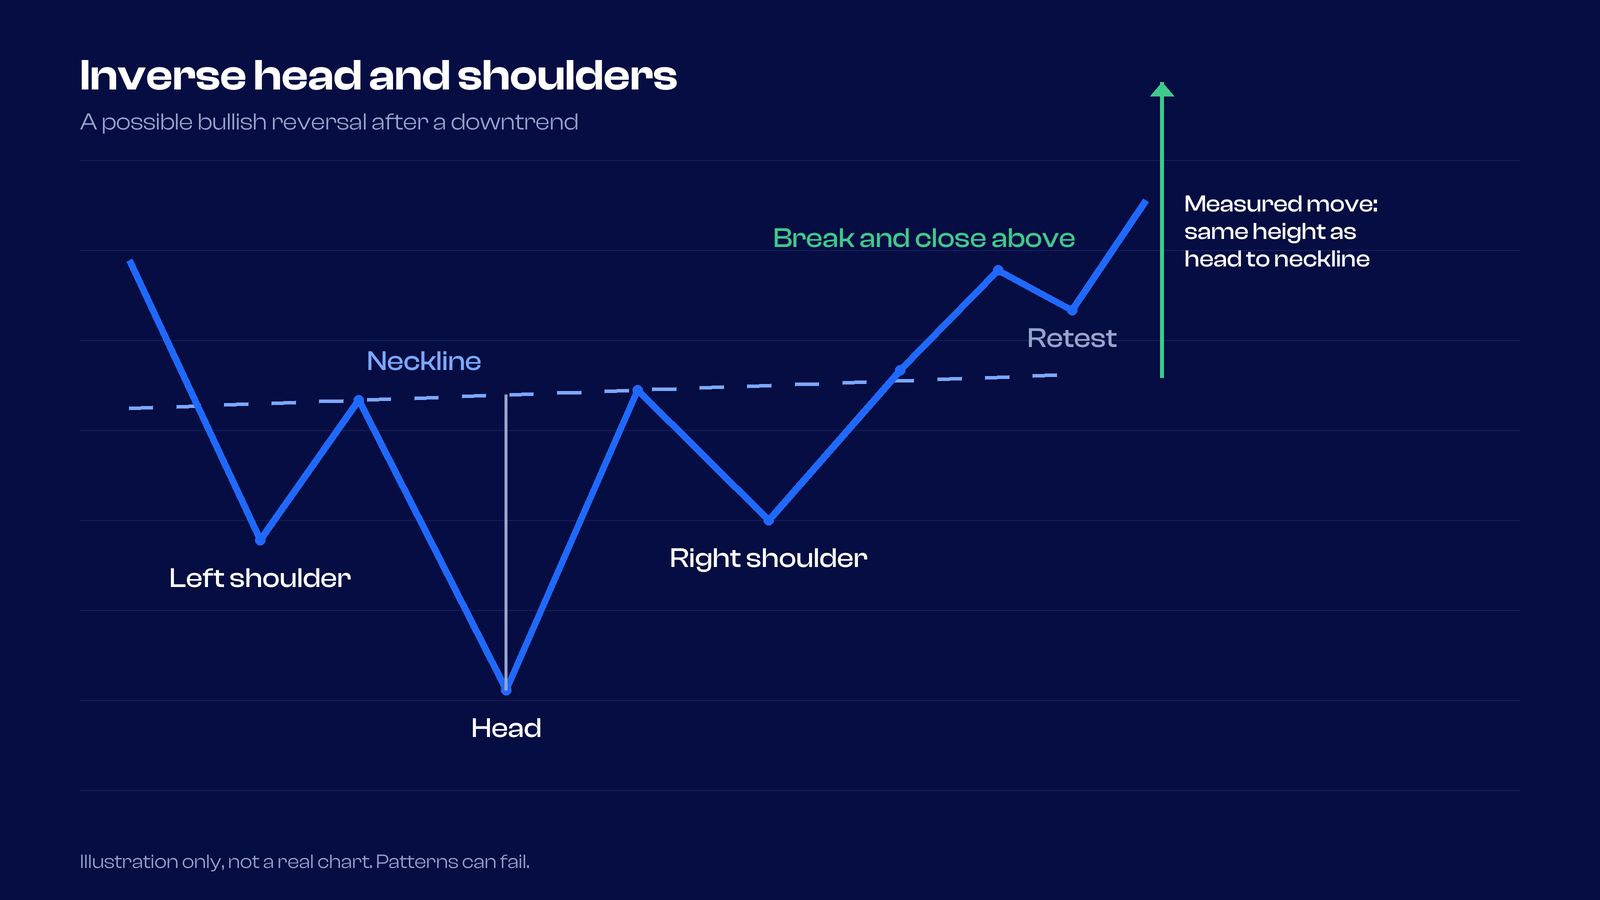
Everything else mirrors the standard pattern: a stop is often placed below the right shoulder, the measured move is projected upwards from the breakout, and a retest of the neckline from above is common.
How often does the head and shoulders pattern fail?
Often enough that it should never be treated as a sure thing. Many shapes never break the neckline, and some breaks reverse straight back, often sharply as traders close losing positions.
Common mistakes include:
- Calling it early. Treating the right shoulder as finished before price has even reached the neckline.
- Ignoring the trend. Reading a reversal pattern into a sideways range, or against a strong trend on a higher timeframe.
- Forcing the shape. Drawing a neckline through whatever points make the picture fit, or accepting shoulders that look nothing alike.
- No plan for failure. Having no stop, or a stop so wide that one failed pattern does serious damage to the account.
- Ignoring context. Patterns that form just before a major news release or in a thin session can break and reverse in minutes.
Traders who use smart money concepts often describe the same move as a lower high followed by a break of a key swing low.
Which timeframes does the pattern work on?
The pattern appears on every timeframe. On the four-hour, daily or weekly charts it takes longer to form and is generally treated as more meaningful. On very low timeframes it forms often, but small moves and spread make it noisy.
Many traders identify the pattern on a higher timeframe and use a lower one to time entries. Session timing matters too: a neckline break during the London or New York session, when forex trading sessions are most active, tends to carry more weight than one in a quiet hour.
How does the head and shoulders pattern fit Alpha Capital's rules?
Trading the pattern on an Alpha Capital simulated account means the usual risk rules apply. The ones most relevant to this pattern are:
- Daily loss limit: between 3% and 5% depending on the plan (for example 5% on Alpha Pro 10% and Alpha Swing, 4% on Alpha Three and 3% on Alpha Direct). It is measured on equity, including open losses, so a stop beyond the head on a large position can use up much of a day's limit.
- Max Risk: on Qualified Analyst accounts bought after 21 July 2026, and on Alpha Direct from the first trade, open losses on any one asset cannot reach 3% (account sizes up to $25,000), 2% ($50,000 to $200,000) or 1% (Alpha Direct, all sizes). Losing positions on the same asset are combined, and costs such as swaps and slippage count.
- News windows: during evaluations, news trading is free. On Qualified Analyst accounts on Alpha Pro, Alpha One, Alpha Three and Alpha Direct, no trade may be opened or closed on the affected instruments from 5 minutes before to 5 minutes after a listed high-impact release, and that includes a stop loss or take profit being triggered. On Alpha Swing, a trade opened within 2 minutes either side of a release must stay open for more than 2 minutes.
- Weekend holds: allowed on Alpha One, Alpha Three and Alpha Swing at every stage, and during the Alpha Pro evaluation. Not allowed on Alpha Pro Qualified Analyst accounts or on Alpha Direct. That matters for patterns on daily charts, which can take days to play out.
For how prop firm accounts and their rules work in general, see our guide on what a prop firm is.
Frequently asked questions
Is the head and shoulders pattern bullish or bearish?
The standard head and shoulders pattern is bearish: it forms after an uptrend and can signal a move lower once price closes below the neckline. The inverse version is bullish and forms after a downtrend.
How reliable is the head and shoulders pattern?
It is widely watched but not reliable on its own: many patterns never confirm, and some breakouts reverse. Traders usually wait for a close beyond the neckline, check the higher-timeframe trend and use a stop.
Where do traders usually put a stop loss on a head and shoulders trade?
A common place is beyond the right shoulder, because a move past it cancels the lower high that defines the pattern. Some traders use the head for more room.
How do you calculate the head and shoulders target?
Measure the distance from the top of the head to the neckline, then project the same distance from the breakout point in the direction of the break. This measured move is a rough guide, and price can stop short of it or go further.
What is the difference between head and shoulders and inverse head and shoulders?
They are mirror images. The head and shoulders has three peaks at the top of an uptrend and signals a possible bearish reversal; the inverse has three troughs at the bottom of a downtrend and signals a possible bullish one.
What timeframe is best for the head and shoulders pattern?
It appears on all timeframes. Patterns on the four-hour, daily and weekly charts are generally seen as more meaningful than those on very low timeframes.
Can you trade the head and shoulders pattern on an Alpha Capital account?
Yes. Chart patterns are allowed on Alpha Capital simulated accounts, as long as the trades follow the account's rules, including the daily loss limit, the Max Risk rule where it applies, news windows on Qualified Analyst accounts and the weekend-hold rule of your plan.